
- Solana remains capped below the $88–$90 supply zone, keeping short-term momentum fragile.
- ETF inflows of $43.75M add medium-term support, but technical confirmation is still needed.
- A reclaim of $89 opens upside toward $100–$110, while a breakdown below $77 increases risk toward $60.
Solana is once again parked at a level where the next move actually matters. After a sharp push higher, SOL ran straight into a well-defined supply zone and was rejected almost immediately. Price now sits near $84, cooling off after failing to sustain momentum above $89, a level that has repeatedly capped upside attempts in recent sessions.
According to Brave New Coin data, SOL trades around $84.41, up just over 3% in the last 24 hours. On paper, that daily gain looks constructive. But structurally, bulls are still dealing with heavy overhead supply that hasn’t been cleared.
$88–$90 Supply Zone Remains the Barrier
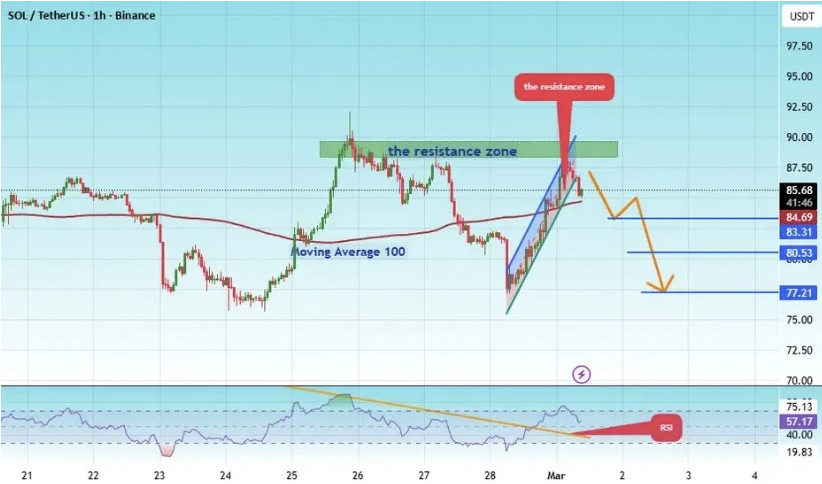
On the 1-hour chart shared by CryptoAnalystSignal, Solana rallied aggressively into the $88–$90 region before stalling. This supply zone has acted as a ceiling multiple times, and once price tapped into it again, sellers stepped in decisively. The rejection shifted short-term momentum back to the downside.
Technically, the levels are clear. Immediate resistance remains between $88 and $90. Intraday support sits around $83.30, followed by $80.50, with $77.20 acting as deeper downside support. As long as SOL trades below $89, the short-term bias stays cautious, even if buyers attempt small rebounds.
Momentum Indicators Send Mixed Signals
Momentum is offering a split picture. On the weekly timeframe, RSI has started to curl slightly higher, and stochastic indicators have flashed early bullish shifts. These signals can precede broader recovery phases, though they often require confirmation from price itself.
On lower timeframes, however, RSI remains capped under a descending trendline and recently turned down after testing mid-range resistance. That divergence highlights the current condition: short-term weakness inside what could become longer-term stabilization. If RSI breaks above its descending structure, another attempt at $89 becomes more likely. Until then, momentum feels fragile.
ETF Inflows Offer Underlying Support
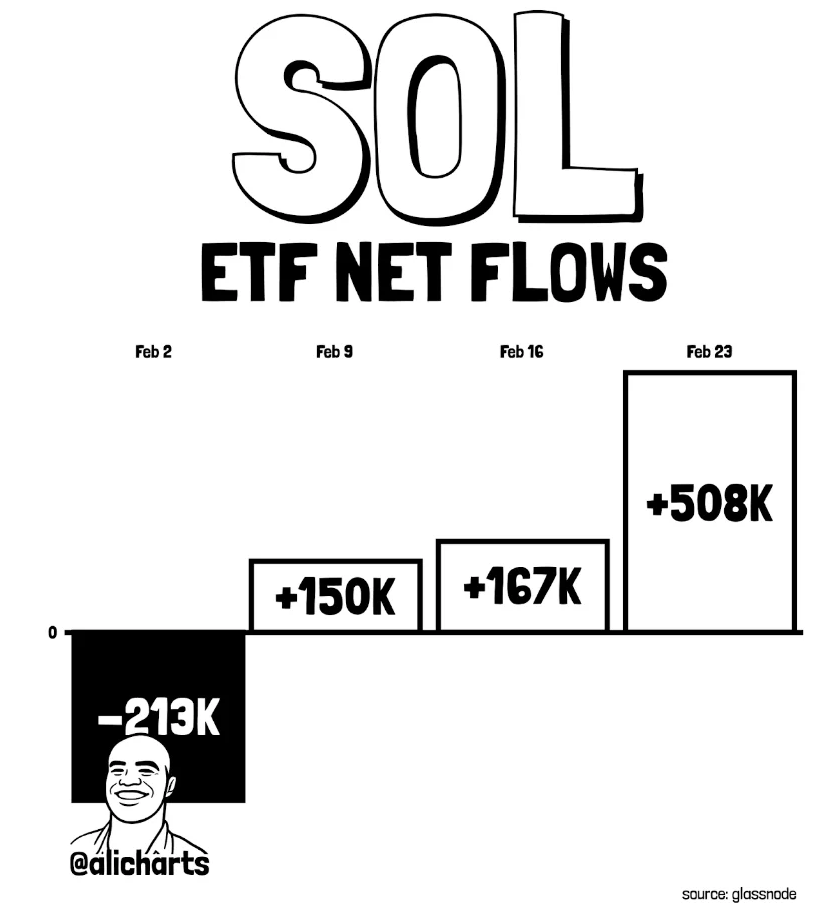
Beyond the technical structure, ETF flows are adding a layer of cautious optimism. Data shared by Ali Martinez shows Solana ETFs recorded approximately $43.75 million in positive inflows last week. While inflows don’t override resistance zones overnight, they can strengthen the broader recovery narrative if sustained.
Institutional participation often builds gradually. It doesn’t show up in explosive candles right away, but over time it can reinforce key support levels. For now, fundamentals appear to be improving slightly, though the chart still demands confirmation.
$110 or $60 – A Range Decision Point
Crypto analyst DrBullZeus framed the broader setup clearly: is SOL headed toward $110, or back to $60? His chart shows price breaking below a mid-range support zone before attempting a rebound, placing Solana at what many would call a range decision point.
If SOL reclaims and holds above $89, the path toward $100 and potentially $110–$115 opens in a stronger recovery scenario. However, failure to reclaim that supply zone keeps downside risk active. A move below $77 would significantly weaken the short-term structure and increase the probability of a deeper slide toward the $60 region.