- SOL trades near $84.55 as liquidation heatmaps show heavy short concentration between $90 and $105.
- A move above $90 could trigger forced short liquidations and accelerate upside volatility.
- Failure to reclaim $90 may keep shorts in control and extend consolidation below resistance.
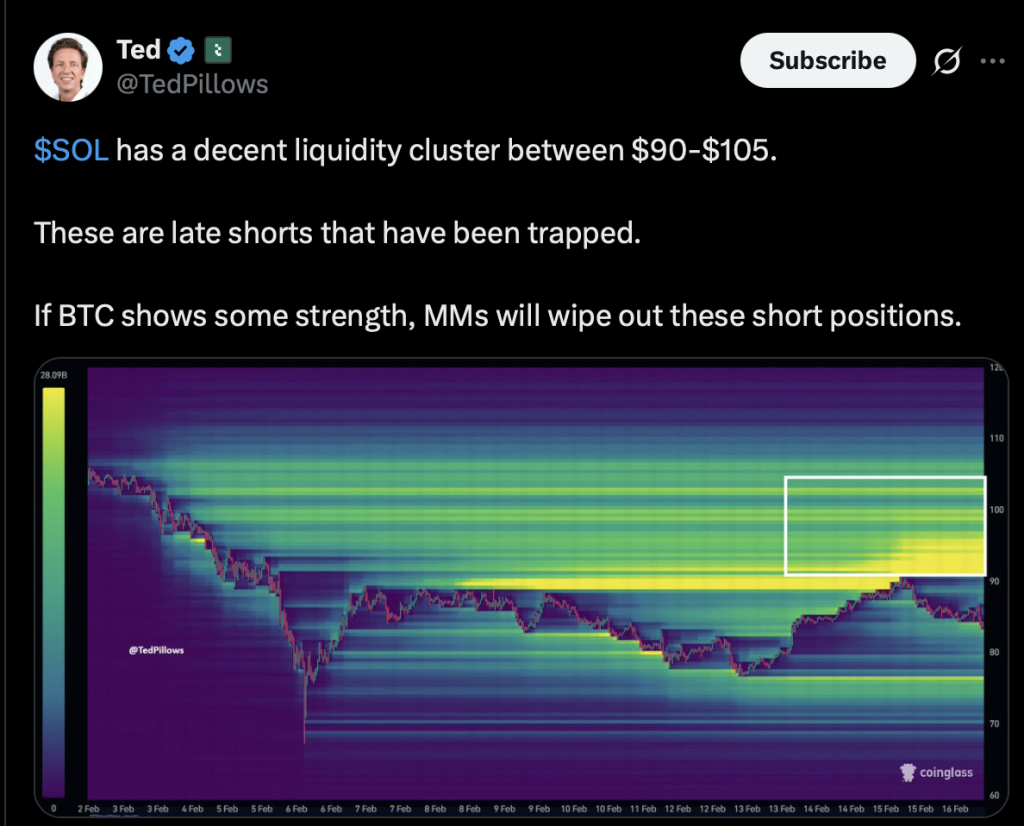
Solana is starting to light up on derivatives dashboards again, and not in a quiet way. Liquidity data shows a thick concentration of short positions stacked between $90 and $105. That range, highlighted through liquidation heatmaps, is basically a pressure zone. If SOL pushes into it with momentum, some of those shorts could be in trouble.
At the time of writing, SOL is trading around $84.55, down roughly 3.07% on the day. Market cap remains above $48 billion, and daily volume sits near $3.92 billion. So while price has dipped, participation hasn’t dried up. It’s just shifting more toward leveraged positioning rather than spot accumulation.
A Dense Short Cluster Sits Just Above Price
The latest heatmap data shows a packed band of liquidity sitting directly above current price, especially between $90 and $105. These maps don’t predict direction, but they do reveal where leveraged positions are concentrated. In this case, it’s clear that a large number of traders opened short positions during the recent pullback.
Those shorts are now sitting above the market.
Clusters like this often mark levels where stop-losses and liquidation triggers pile up. If SOL rallies into that zone with enough force, those positions could be forced to close. And forced closures in shorts mean buy orders. That’s where things can accelerate quickly.
Importantly, this positioning appears to be coming from perpetual futures and other leveraged products, not from spot markets. That distinction matters. Spot holders don’t get liquidated the same way. Leveraged traders do, and sometimes very fast.
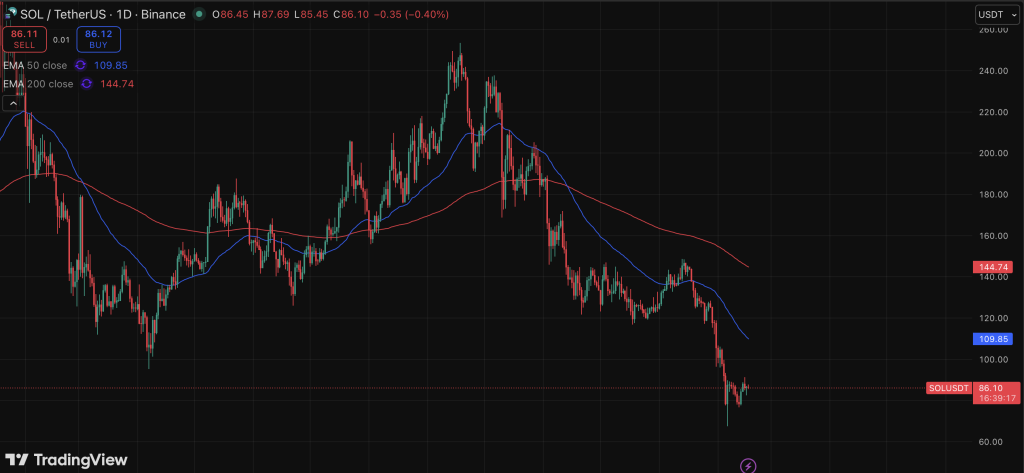
SOL Is Stabilizing, But $90 Is the First Real Test
After the recent pullback, SOL has started to steady below the liquidity band. Price structure shows a slow attempt at recovery, but it’s still under the $90 threshold. That level is now the first meaningful barrier.
Traders who shorted the drop likely view $90 as a comfort zone. If price stays below it, their positions remain intact. But if SOL pushes above and holds, the risk profile flips. What looked like a controlled short could turn into a squeeze candidate.
Between $90 and $105, the liquidity gets thicker. That means volatility potential increases the deeper price moves into that range. It’s not just resistance anymore. It’s a possible chain reaction zone.
How Short Liquidations Can Fuel Volatility
When short positions get liquidated, traders are forced to buy back SOL to close their contracts. That buying isn’t optional. It’s mechanical. And when enough of those orders stack up at once, the result can be sharp upward candles in a short window.
This is what’s commonly referred to as a short squeeze.
That said, liquidity heatmaps don’t guarantee that price will go there. They simply show where volatility could spike if triggered. If SOL fails to reclaim $90 and instead drifts lower, the cluster above becomes irrelevant, at least temporarily. Shorts remain comfortable, and momentum cools off.
Breakout Setup or Continued Consolidation?
Right now, Solana sits at a pivot. Price is below the cluster, derivatives participation is elevated, and short positioning is dense above. If buyers step in and push SOL through $90 with conviction, the move toward $105 could become self-reinforcing.
If not, consolidation continues, and the shorts stay in control.
The market is basically coiled around that $90 line. Once it breaks one way or the other, the reaction probably won’t be subtle.