
- Litecoin is posting steady gains, suggesting controlled accumulation rather than speculative spikes
- Price remains in a broader downtrend, but selling pressure appears to be easing
- Momentum indicators show early signs of stabilization, with a possible shift if buyers stay active
Litecoin has been quietly pushing higher, showing signs of a healthier price trajectory as buying interest starts to strengthen. Over the past 24 hours, LTC climbed roughly 3.36%, while its weekly gain sits near 3.65%. The move feels more controlled than speculative, suggesting gradual accumulation rather than a short-lived spike driven by hype.
At the time of writing, Litecoin is trading around $80.09. Daily trading volume has risen to approximately $304.75 million, up just over 12%, while market capitalization now stands near $6.14 billion. That steady increase in both volume and market cap points to improving liquidity and consistent participation, not a rush in and out.
Price Action Suggests Stability, Not a Full Trend Reversal
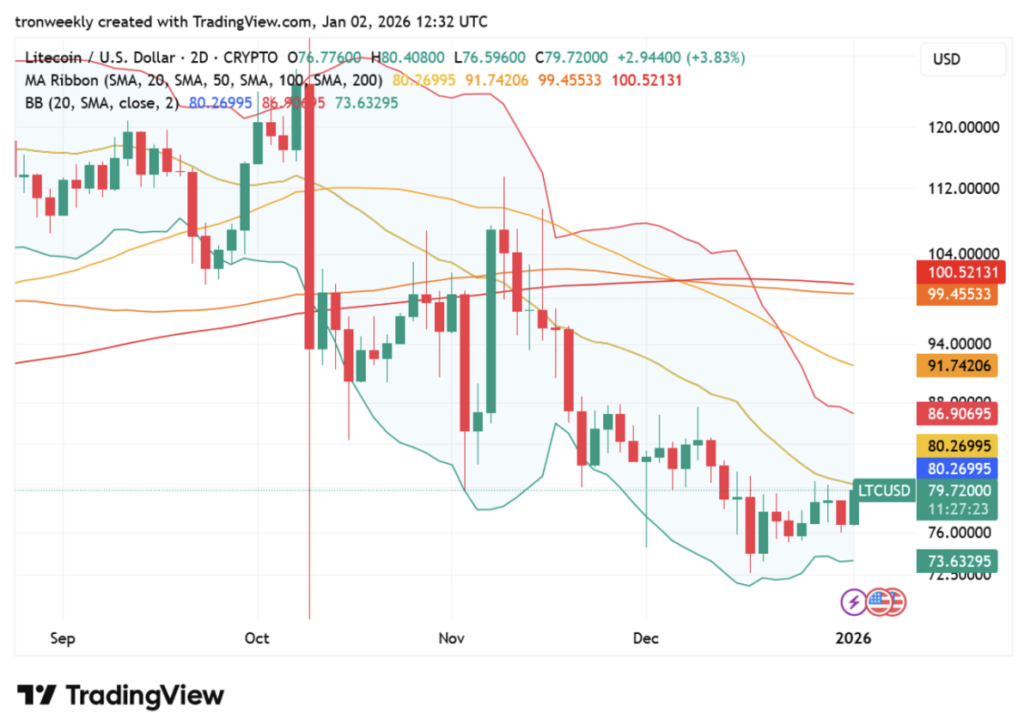
Zooming out to the 2-day chart, Litecoin is still locked inside a broader bearish structure. Since peaking near $120 in October, price has printed lower highs and lower lows, and the SMA ribbon remains fully above current price levels while sloping downward. That setup reinforces the idea that this is stabilization, not a confirmed trend reversal, at least not yet.
Recently, LTC bounced from the lower Bollinger Band zone between $73 and $75, hinting at a mean reversion move. Candle sizes have been shrinking, which suggests selling pressure is easing. Still, price remains below key moving averages and the Bollinger midpoint, meaning this bounce lacks strong conviction so far and could simply be a corrective rally within the downtrend.
Key Levels Define the Next Move
Support remains firm around the $73 to $75 zone, but a breakdown below that area would reopen downside risk. On the upside, immediate resistance sits near $80 to $82, with a stronger barrier forming around $86 to $87 near the 50-day SMA. Above that, a heavier supply zone exists between $91 and $100, where sellers previously stepped in aggressively.
If the broader trend were to shift, macro targets between $104 and $120 come back into view. For now though, those levels feel distant, and price needs to prove itself step by step before that narrative gains traction.
Momentum Indicators Hint at a Possible Shift
Momentum signals are sitting near neutral, which fits the current price behavior. The RSI (14) is hovering around 44, still below the 50 mark and technically bearish. However, it’s rebounding from recent lows in the mid-30s, suggesting selling pressure is cooling and buyers may slowly be regaining confidence.
The MACD remains in negative territory, confirming the broader bearish trend is still intact. That said, the histogram has turned slightly positive, and the MACD line is creeping closer to the signal line. It’s an early sign, not confirmation, but it does hint that bearish momentum is weakening and a potential shift could be forming if buying continues.