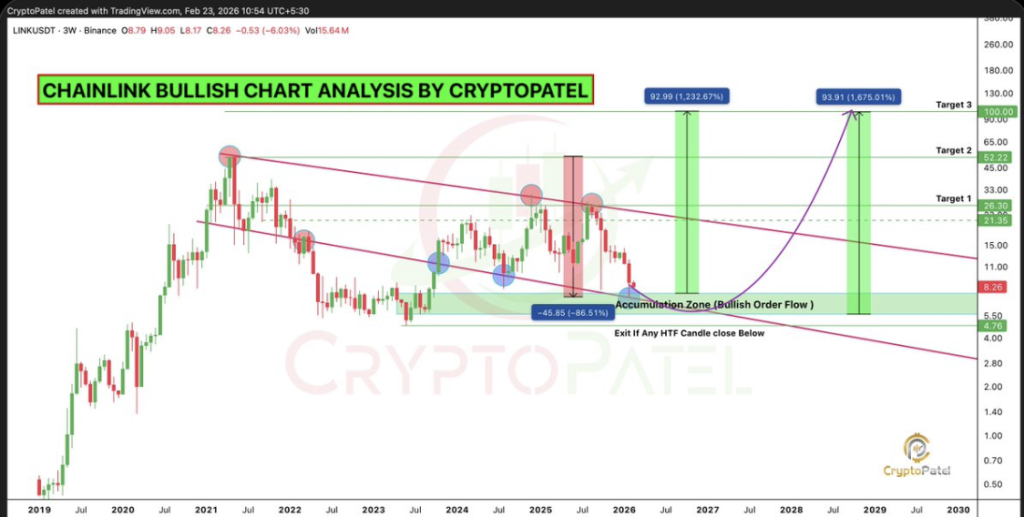
- LINK is trading near $8 within a multi-year descending channel after an 86% correction from its 2021 high.
- Analysts highlight strong accumulation between $5.60 and $7.50, with volatility compressing on the three-week chart.
- A confirmed three-week close above channel resistance could trigger upside targets at $26, $52, and potentially $100, while $4.76 remains key invalidation.
Chainlink’s LINK token is sitting around $8.30 after what feels like months of sideways compression. Volatility has dried up. The chart looks tight, almost coiled. And according to analyst CryptoPatel, that compression could be the early stage of something much larger.
On the three-weekly timeframe — which is about as zoomed out as most traders dare to go — LINK has been trapped inside a descending channel since its 2021 peak near $53. From that high, price collapsed more than 86%. It wasn’t quick. It was drawn out. Painfully so.
Now, however, LINK is trading inside what CryptoPatel calls a multi-year demand block between roughly $5.60 and $7.50. That zone has repeatedly attracted buyers. Not loud buyers. But consistent ones.
Signs of Accumulation Beneath the Surface
What stands out on the higher timeframe is the formation of multiple higher lows within that demand area. Each time price dipped toward prior support, buyers stepped in slightly earlier. That’s not what distribution looks like. It looks more like absorption.
CryptoPatel describes it as “smart money accumulation.” Sell-side liquidity sweeps into the zone have been absorbed rather than extended downward. In other words, attempts to break lower have stalled.
He also points to what he calls a fractal structure — a pattern on the chart that mirrors previous accumulation phases before major expansions. In earlier cycles, similar compressions preceded sharp directional breakouts. History doesn’t have to repeat exactly. But markets do rhyme, sometimes.
Volatility on the three-week chart has contracted to extreme levels. That kind of compression rarely lasts forever. It usually resolves with a larger expansion move. The only question is direction.
Right now, price is hovering near what he defines as range equilibrium around $8. The descending channel resistance from the 2021 high remains intact. That’s the ceiling bulls must break.
What Would Confirm a Breakout?
CryptoPatel has outlined three upside targets if a breakout materializes: $26.30, $52.22, and $100. The highest target would represent roughly a 1,100% gain from current levels. From the lower boundary of the demand zone, projected returns stretch even further.
But there’s a condition.
The setup requires a three-weekly candle close above the descending trendline resistance. Not an intraday wick. Not a single green weekly candle. A confirmed higher timeframe close. That would signal structural change.
Until then, resistance remains resistance.
The hard invalidation level sits at $4.76 on the three-week chart. A confirmed close below that threshold would undermine the entire accumulation thesis and suggest further downside risk. That’s the line in the sand.
CryptoPatel frames this as a patience trade. High timeframe. Asymmetric risk-to-reward. More suited for long-term spot accumulation than leveraged short-term speculation.
There’s no macro overlay in this forecast. No ETF flows, no tokenomics deep dive. Just structure. Just price.
And right now, LINK is compressed inside a multi-year channel, sitting on a demand zone that has held repeatedly. Whether that compression resolves upward or breaks lower will likely define the next major phase for the token.
For now, the chart is quiet. Almost too quiet.