
- HBAR dropped 6% to $0.1925 as short positions climbed and volume fell 38%.
- Key support sits near $0.1888; a break below could trigger another 20%+ drop.
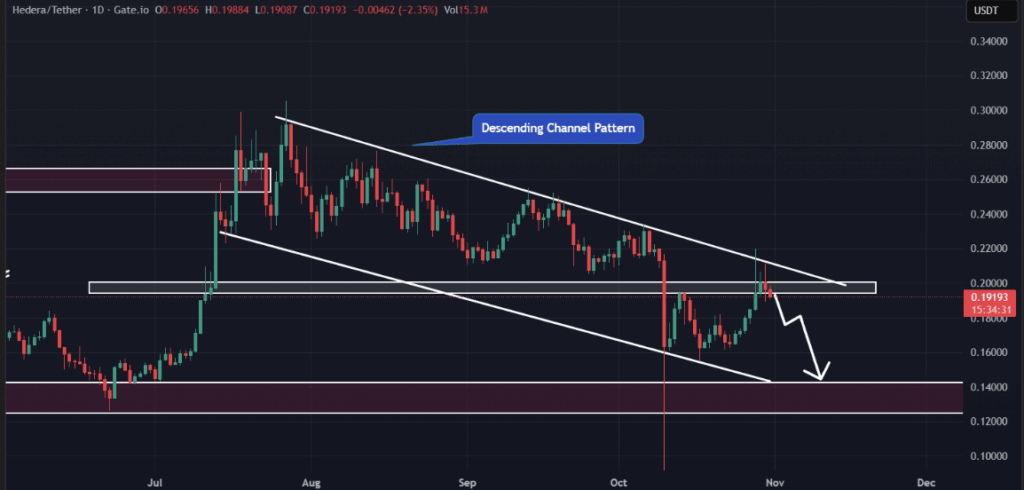
- A breakout above the descending channel and sustained ETF inflows might finally shift sentiment bullish.
Hedera (HBAR) just can’t seem to catch a break right now. After another 6% slide, the token’s sitting around $0.1925—its second straight day in the red. Trading volume’s also dropped off a cliff, down nearly 38% to just $512 million. And to make matters worse, short positions are climbing fast, feeding even more downward pressure into the market.
According to CoinGlass, traders are clearly favoring the bearish side of the trade. At the moment, liquidation levels sit near $0.1888 on the downside and $0.1972 on the upside. That’s a narrow range, and with $7.24 million stacked in shorts versus just $2.9 million in longs, the crowd’s sentiment is leaning heavily negative. If HBAR slips below that $0.1888 level, those long positions could get wiped out fast. It’s a rough setup, and it’s keeping bulls on edge.
Technicals Show the Downtrend Still Has Momentum
Looking at the charts, HBAR’s stuck in a clear downtrend—below its 200-day EMA and still trapped inside a descending channel that’s been tightening for weeks. The daily chart shows a fresh bearish candlestick pattern taking shape, and if today’s candle closes below $0.188, that could open the door to deeper losses, maybe down toward $0.142 over the next leg.
The indicators aren’t offering much relief either. The Average Directional Index (ADX) sits around 34.2, well above the 25 threshold that signals strong trend momentum. Unfortunately, that “strong trend” is bearish. The Supertrend indicator’s also flashing red, confirming what most traders already suspect—the downtrend isn’t done yet.
Where a Reversal Might Start
Still, all isn’t lost. A shift in momentum could happen if HBAR manages to break out of its descending channel and close a daily candle above it. That would be the first real technical sign that sellers might finally be losing grip. Beyond the charts, one key factor could also help turn sentiment: the newly approved spot HBAR ETF in the U.S.
The ETF, launched by Canary Capital, brought in a surprising $45 million in inflows right out of the gate—a signal that institutional investors are starting to take notice. If those inflows continue and price stabilizes above the channel, we could see the beginnings of a trend reversal.
Market on Edge as Traders Wait for Direction
For now, though, the market feels cautious—maybe even a little tense. The short side’s in control, and volume’s too thin for any strong pushback from bulls. If HBAR holds above $0.188 and ETF optimism grows, a bounce toward $0.20–$0.21 might be on the table. But if it cracks below that key support, the next stop could easily be $0.14 or lower.
At this point, HBAR’s at a crossroads. A breakout could flip the narrative completely, but failure to hold support would just extend the pain. Traders are watching closely to see which way it leans next—because whichever direction it takes, the move might be sharp.