
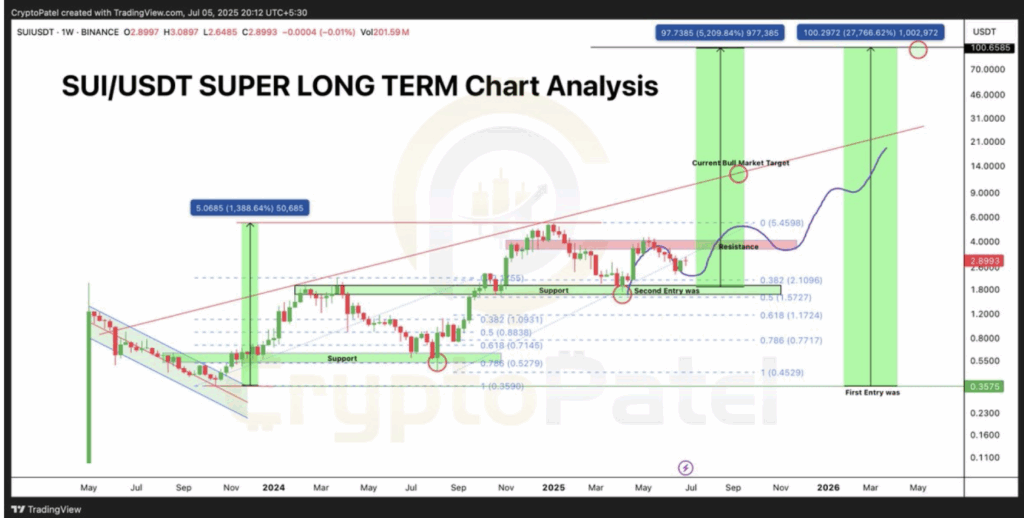
- Crypto Patel sees a long-term move from $0.35 to $100 on SUI, backed by trend reversals and fib levels.
- The $14 target is the next key level if SUI breaks current resistance around $2.89.
- While it might sound wild, the setup isn’t fantasy—it’s structured, long-term, and not without historical parallels.
Crypto Patel just dropped a chart for SUI that’s got people doing double takes—not just because it looks clean, but because of what it’s implying. A long-term roadmap that starts around $0.35 and stretches all the way to $100. Sounds like a fantasy, yeah? But let’s unpack it a bit.
On the weekly timeframe, SUI has been grinding up from its bottom near $0.35, slowly but surely reclaiming key zones and forming what looks like a classic reversal structure. It’s not just noise either—the bounces have lined up with fib levels and support zones, like clockwork. And right now, it’s hovering just under a resistance that it’s tapped multiple times.
There are two major zones Patel’s chart points to as ideal entries. The bottom—around $0.35, obviously—and another between $1.50 and $1.70. That second zone? It’s right around the 0.618 Fibonacci retracement, which, for seasoned traders, is where serious moves often launch from.
SUI’s Next Stops? First $14… Then $100?
Currently, SUI’s trading near $2.89 and still knocking on that resistance ceiling. If it manages a proper breakout—and actually holds above it—the first stop on Patel’s roadmap is $14. Not a bad upside from here.
But that’s just the appetizer.
The real eye-popper is what he labels as the “Current Bull Market Target”—a price zone in the $97 to $100 range. Yup, triple digits. If that plays out, early buyers at $0.35 could be staring at a 27,000% return. Even those getting in now could see solid gains, assuming the momentum holds and macro conditions cooperate.
Now, sure, this might sound like classic bull market hopium. But it’s not unheard of. We’ve seen stuff like this happen before—coins going full rocketship when hype, narrative, and tech come together. And let’s not forget, SUI’s ecosystem is still expanding and has its own buzz in the modular chain space.
This Isn’t Just Chart Porn
Patel’s chart isn’t just for show—it actually tells a story. One about patient accumulation, strategic fib levels, and support-resistance flips. You’re not gonna wake up tomorrow to $100 SUI, but that’s not the point. It’s about seeing a potential multi-year trend forming… a real one.
The structure is clean—higher lows, consolidations, breakouts, and retests. It’s textbook bull market behavior, if it keeps playing out. This isn’t about chasing green candles. It’s about having a map for the road ahead.
So… Can SUI Really Hit $100?
No guarantees, obviously. It’s crypto. Anything can happen. But the chart gives a pretty compelling visual for what might be possible if SUI sticks to the script. With solid tech, decent buzz, and the market heating up again, you never really know.
And if it ever does hit $100? Well, those $0.35 buys might just go down as one of those legendary crypto entries.