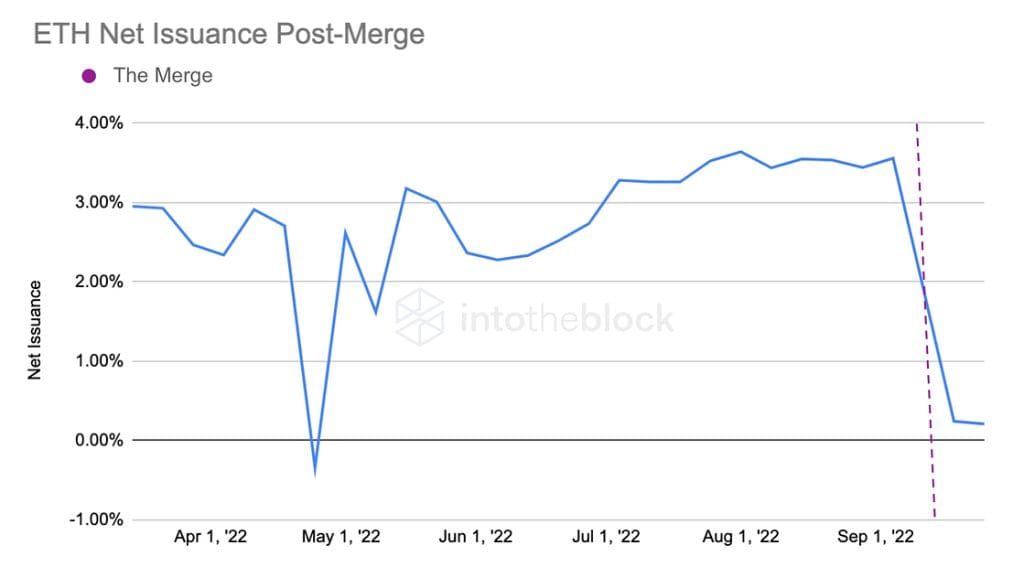
Just over two weeks after the successful completion of the Ethereum Merge, it marked the transition of the blockchain from a proof-of-work (PoW) to a proof-of-stake (PoS) consensus mechanism. Despite the success of this much-awaited upgrade, there has been an unexpected decline in issuance due to decreasing network demand.
This article also depicts Ethereum’s on-chain activity in Q3/2022 by analyzing NFT, DeFi, and total transfer volume.
Decreasing Supply Meets Decreasing Demand
The much-anticipated upgrade in the crypto industry’s history finally took place when Ethereum transitioned to PoS on September 15. With the upgrade, the most popular network for dApp developers now consumes 99.95% less energy than it used when it was a PoW protocol. This is because miners are no longer required to support the network.
Another benefit expected with the Merge was a reduction in ETH issuance – the process of creating ETH that did not previously exist. The amount of ETH issued per day dropped between 85% and 90% per day. However, ETH did not become deflationary as many had predicted.
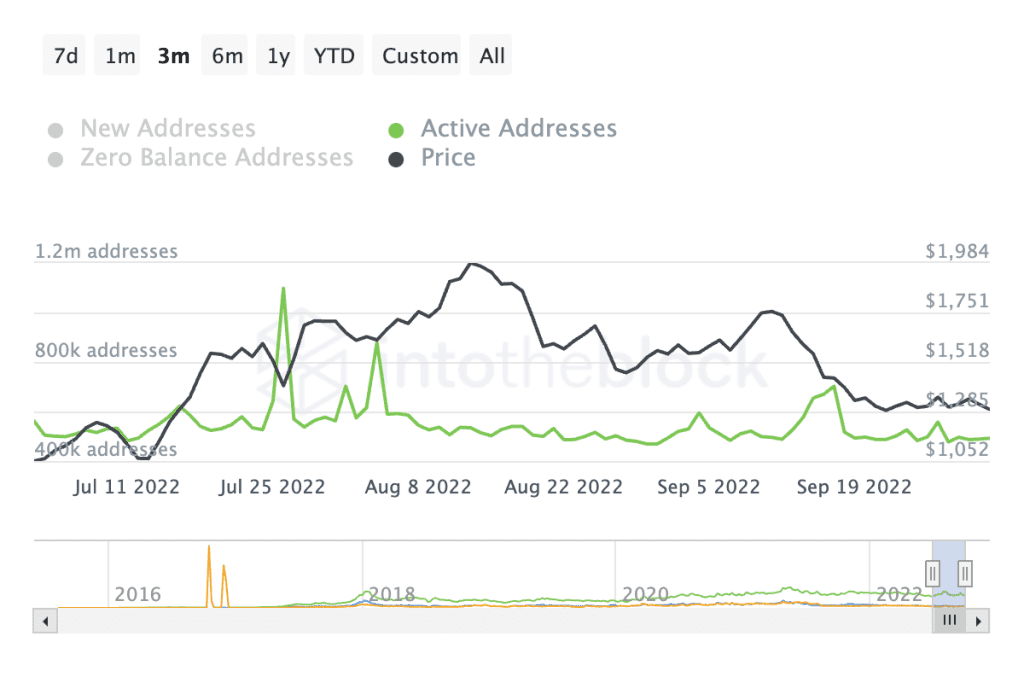
IntoTheBlock, an on-chain data and market insights firm, attributed the failure of deflationary ETH to decreasing network usage. The number of active addresses has dropped from a high of 1.1 million in July to around 492 at the time of writing this article. This points to decreasing network demand which has, in turn, resulted in an approximately 80% drop in Ethereum fees over the quarter. The lack of demand has resulted in less ETH being burned daily as gas prices remain low.

One of the possible reasons for low fees on the Ethereum network is the increased adoption of Layer 2 protocols, with Arbitrum and Optimism registering a nearly threefold increase in daily transactions in Q3/2022, according to data from Etherscan.
Declining NFTs and DeFi Volumes
Another reason why the expected deflationary ETH was not achieved after the Merge could be the decreasing interest in non-fungible tokens (NFTs), which has been on a downward spiral since the start of the year.
The NFT Daily Volume chart shows that NFT volumes are down more than 95% in terms of ETH since their record highs in January 2022. To put this into perspective, the total NFT volume transacted in Q3/2022 has dropped by 52% to 2.6 million ETH, up from 5.5 million ETH in Q2/2022. ETH burned has been positively associated with NFT volumes with a correlation coefficient of 0.58 year-to-date, suggesting a strong relationship between the two indicators.
Interestingly, new addresses using NFTs on the Ethereum mainnet increased by 22%, implying that new users may still be trying to use their digital arts but may be unwilling to pay higher gas fees.

Moreover, top decentralized finance (DeFi) protocols built on Ethereum have recorded a decrease in demand. For example, Uniswap v3 recorded a 30% decrease in volumes in Q3/2022 compared to the previous quarter and reached its lowest monthly volume in the past year. Similarly, Curve recorded an over 57% drop in transaction volume quarter-over-quarter.
Conclusion
The high speculation in the crypto market has severely declined to lead to the decaying volumes experienced in DeFi and NFTs on the Ethereum network. This has led to significantly lower Ethereum demand that partially offsets the supply shock from Merge’s reduced issuance.
Ether’s price now stands at $1,295, approximately 28% below its pre-merge levels of around $1,800. Ethereum is down 1.5% over the last seven days and 17.77% in the past 30 days. Its market capitalization now stands just below $160 billion, 0.16% off on the day.


