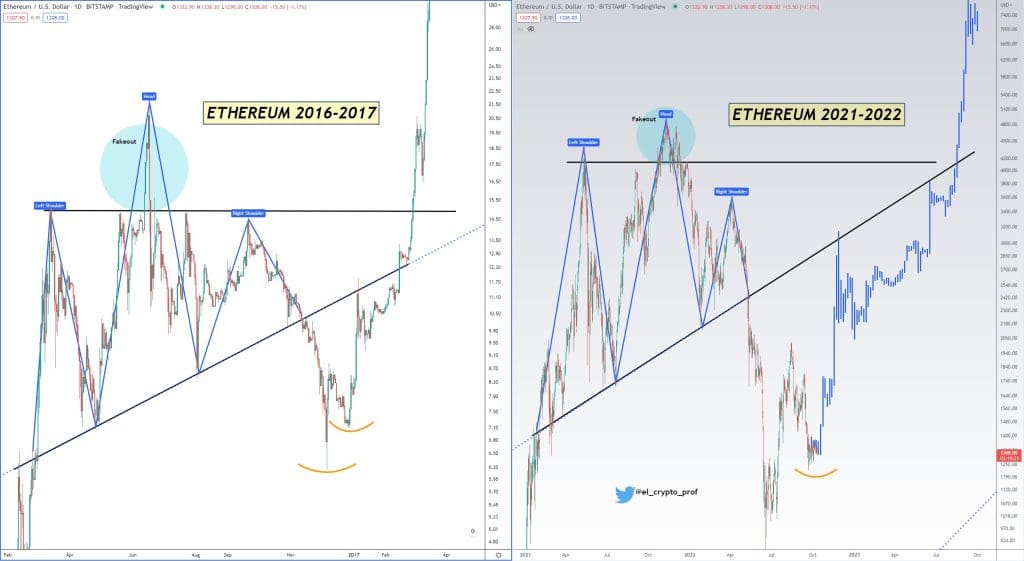
Cryptocurrencies brace for volatility as the market awaits the highly anticipated September Consumer Price Index (CPI) data due Thursday, October 13, 2022. Market participants expect month-over-month growth, and a higher increase in CPI will be a surprise that could lower risk assets like Bitcoin and other cryptocurrencies. Despite the uncertainty, experts predict that the Ethereum price could start one of the largest rallies in history, surpassing $5,000.
Ethereum Price Could Explode If This Pattern Repeats Itself
Ether’s price has been oscillating around the $1,300 psychological level following the post-merge sell-off that saw the crypto drop to $1,220. At the time of writing, ETH was teetering around $1,278, down 1.5% on the day, according to data from CoinMarketCap.
Although Ethereum is currently more than 75% lower than its peak of around $5,000 in November 2021, it has remained relatively steady over the last couple of weeks.
According to experts, this indicates that long-term investors remain unbothered by the current bear market conditions.
According to market analysis experts, Ethereum may be primed for a bull run that could be the most significant since the token launch. A crypto price analysis expert going by the name @el_crypto_prof on Twitter stirred a discussion by saying that Ether’s price action was forming the same pattern it did in 2016-2017, signaling a massive recovery could be in the offing.
He posted the following two charts on Twitter saying:
“Ethereum will soon start one of the biggest bull markets in the history of cryptocurrencies. Pattern from ’16-’17 repeats almost identically.”

As mentioned earlier, ETH has been holding around the $1,300 zone with low volatility. Despite this mild volatility, traders are still interested in the now proof-of-stake token.
Over that 24 hours, Ethereum’s daily trading volume has risen 8.34% to $8.84 billion, meaning that traders have been buying ETH at lower prices. Given the slight gains reported over the last day, it is clear that the majority of volumes are coming from buyers.
Ether’s Return On Investment (ROI) is also close to 300% at an annualized rate. This suggests that investors have increased their investments by nearly 4X per year since mid-2014. Data from IntoTheBlock shows that with the impressive ROI, the second-largest altcoin has outperformed U.S. equities. This points to a growing interest in the network, primarily fueled by the decentralized finance (DeFi) and non-fungible token (NFT) sectors.
Ethereum Price Analysis
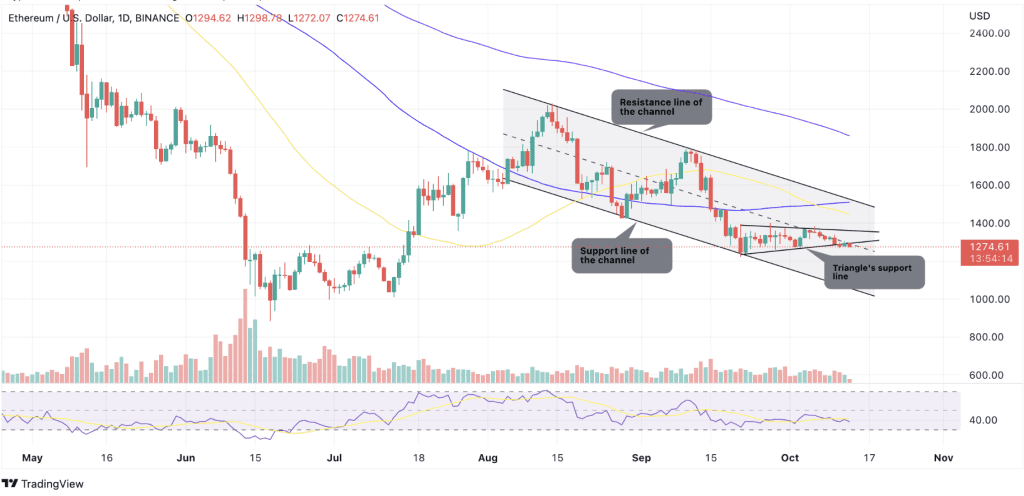
Ether slipped below the symmetrical triangle on October 11, but a positive sign is that the bulls purchased the dip and tried to push the price back into the triangle on October 12. However, selling witnessed during the early trading sessions on Thursday made the smart contracts token cost back below the triangle’s support line.

The moving averages are sloping down, and the relative strength index (RSI) is in negative territory, indicating that bears are in control. The sellers will try to stall any recovery at the triangle’s resistance line around $1,380.
If the price turns down from the current level and breaks below $1,233 embraced by the middle boundary of the descending parallel channel, it will suggest the resumption of the down move. ETH could then decline to the next support at $1,020, the support line of the medium.
The first sign of strength will be a break and close above the triangle. That could pave the way for a possible rally to the resistance line of the channel and beyond.


