
- Dogecoin is stabilizing near $0.120 despite the launch of the TDOG ETF
- Technical structure remains bearish, with resistance around $0.129–$0.134
- A confirmed breakout is needed to shift momentum and sentiment meaningfully
Dogecoin is hovering around $0.1257 after bouncing from a recent dip, at a time when the wider crypto market is still digesting the launch of a new DOGE-based ETF. The 21Shares Dogecoin ETF, trading under the ticker TDOG, gives investors 1:1 exposure to DOGE and marks another step toward institutional access for memecoins. It follows earlier launches like the REX-Osprey Dogecoin ETF and the Grayscale Dogecoin Trust, which hit the market in September and November last year, so this isn’t entirely new territory anymore.
Even so, DOGE hasn’t exactly reacted with fireworks. Price action remains relatively calm, with charts showing Dogecoin stabilizing near the $0.120 level, an area aligned with a key Fibonacci support. Traders are now watching closely to see whether Dogecoin can push back toward the $0.129 resistance zone and extend this short-term recovery, or if momentum simply fades again.
Dogecoin Price Stalls Despite TDOG ETF Launch
The TDOG ETF allows traditional investors to gain exposure to Dogecoin through regulated markets, without needing wallets or direct crypto custody. While the product’s arrival is notable, much of the buzz had already circulated before the official launch, which may explain the muted response. In many ways, this felt like confirmation rather than surprise, and markets tend to react accordingly.
From a technical perspective, Dogecoin remains stuck inside a broader descending channel. Resistance sits near $0.134, while support is holding around $0.116, suggesting structure is still dictating price more than headlines. Even with trading volume jumping more than 36% to roughly $1.29 billion over 24 hours, indicators like the Awesome Oscillator remain negative, hinting that upside momentum hasn’t fully arrived yet.
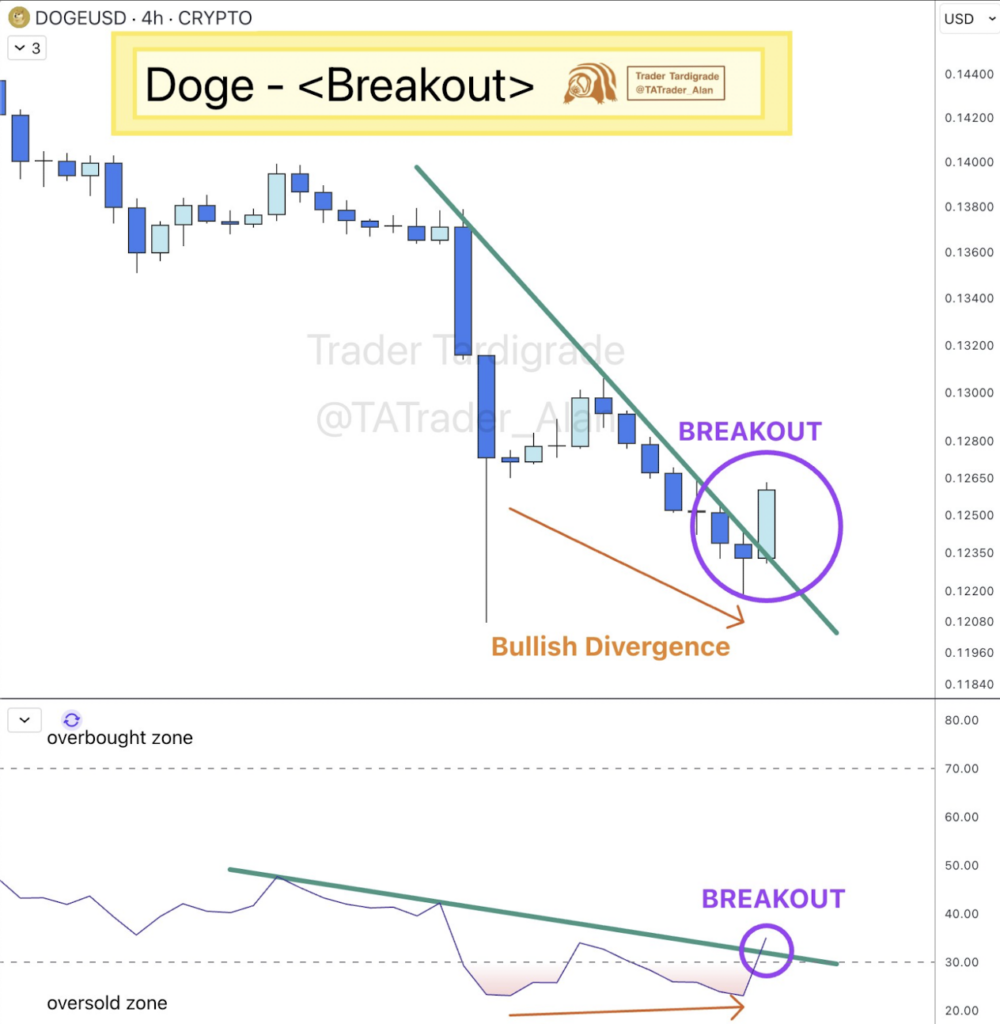
Dogecoin Chart Shows Divergence and Trendline Break
Some analysts, including Tardigrade, have highlighted a bullish divergence forming on Dogecoin’s 4-hour chart. The RSI has pushed above a key level, while price has broken out above a descending trendline, which often signals early trend reversal potential. It’s not a confirmation on its own, but it’s enough to get traders paying attention again.
If Dogecoin can clear the $0.129 resistance and stay above $0.120, this structure could support a more sustained recovery. On the flip side, failure to hold these levels may send price back toward $0.116, the 1.618 Fibonacci extension area. For now, DOGE remains in consolidation mode, with buyers and sellers testing each other. A real shift in sentiment likely needs a confirmed breakout and momentum indicators flipping decisively positive, otherwise this could stay range-bound a bit longer.