
- Dogecoin broke out above $0.16, ending a months-long downtrend.
- Analysts eye upside targets between $0.20 and $0.25 if volume returns.
- A fractal pattern from 2015–2017 hints at a longer-term bullish phase, maybe even a shot at $1 if momentum sticks.
Dogecoin’s finally showing some teeth. After months of dragging through a bear trend, it’s clawed its way back above $0.16—and that’s got analysts raising their eyebrows. The move might seem modest, but after the chop-fest DOGE’s been stuck in lately, it’s starting to look like a real breakout.
A Breach, Some Buzz, and a Few Bold Targets
That $0.16 zone? It’s been a stubborn ceiling since spring, but now Dogecoin’s cracked it—barely. This flip from resistance to support could be big, assuming buyers don’t just vanish like they sometimes do when the meme hype fades.
Ledger Bull (yep, that’s the handle) dropped a chart on X with some spicy upside targets: $0.20333, $0.22899, and $0.25383. Now, these aren’t guarantees, but if DOGE stays strong and closes above $0.203, that might be the green light for another leg higher.
Volume popped during the breakout but then cooled off. So, it’s wait-and-see. Bulls are hoping that when the next move kicks in, volume shows up again—otherwise this thing could just fizzle out.
Trendline Retest or Fakeout Bounce?
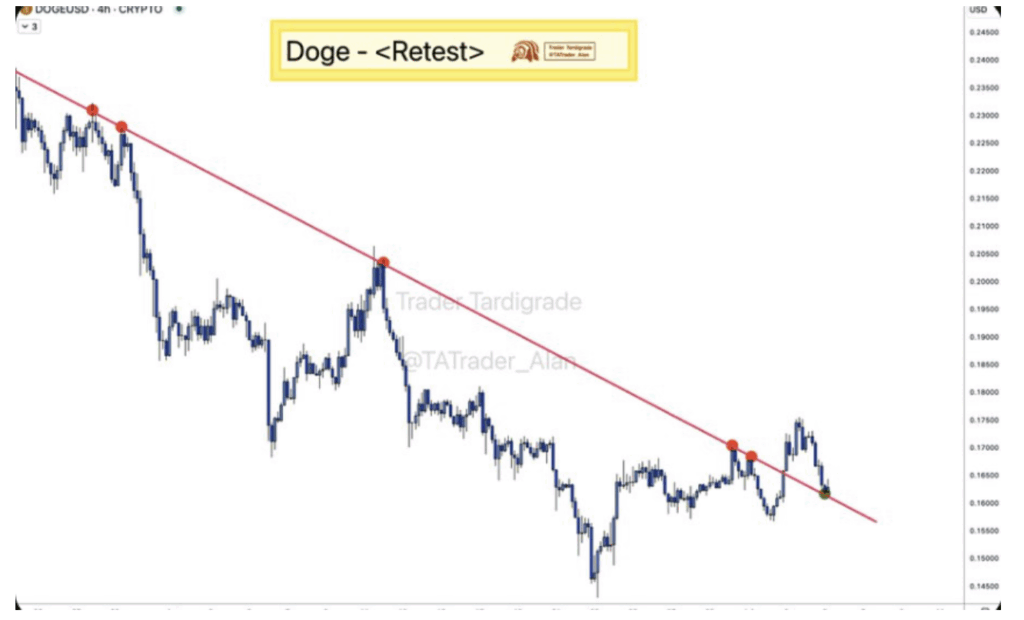
Another analyst, Trader Tardigrade, spotted DOGE retesting a long-term descending trendline. This line had been the bane of every rally attempt for weeks… and now Dogecoin’s back to poke at it again. It’s sitting in that $0.158–$0.162 zone, which could be a solid bounce point—assuming bulls actually show up.
This is one of those textbook patterns where price breaks a trendline, pulls back to retest it, then hopefully springs upward. But if it can’t hold, well, back to the basement.
If DOGE puts in a higher low here with decent volume on the candle up—then yeah, maybe this trend’s turning around for real. Could see a clean shot to $0.20 if that happens.
2015–2017 Déjà Vu?
Now here’s where it gets weird… GalaxyBTC claims Dogecoin might be repeating a fractal pattern from 2015–2017. That old setup had DOGE running through a triple-wave accumulation phase before taking off. The current weekly chart’s apparently doing something eerily similar.
He’s tracking the third wave now, sitting just before the point where things historically popped off. The support line’s been holding up for months, and a second weekly touch just happened. If the fractal plays out again? We could be looking at a slow crawl to $0.25—or maybe even $1 down the road if the hype train really kicks in.
But again, this is Dogecoin. It runs on memes and momentum. If the bulls stick around and volume keeps creeping higher, this could actually turn into something.