- DOGE gained 7.5% and retook $0.254, but $0.36 looms large as resistance.
- Spot traders dumped $39M worth of DOGE, raising short-term downside risks.
- Heatmap shows key buy/sell zones that could trigger sharp moves either way.
Dogecoin just made a move, climbing 7.5% over the last 24 hours and briefly reclaiming the $0.254 level. On the surface, that’s solid—especially for a coin that’s been kinda quiet lately. But not everything’s sunshine and rockets here. Several signals are now flashing red, hinting that this rally might be short-lived.
The $0.36 Wall—And Why It’s a Big Deal
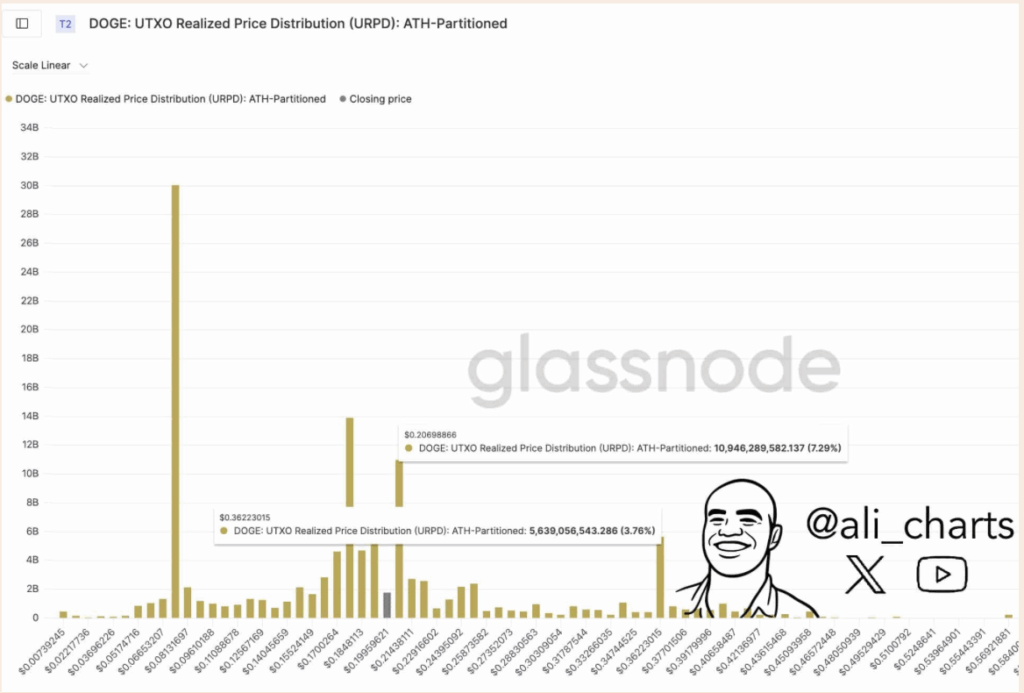
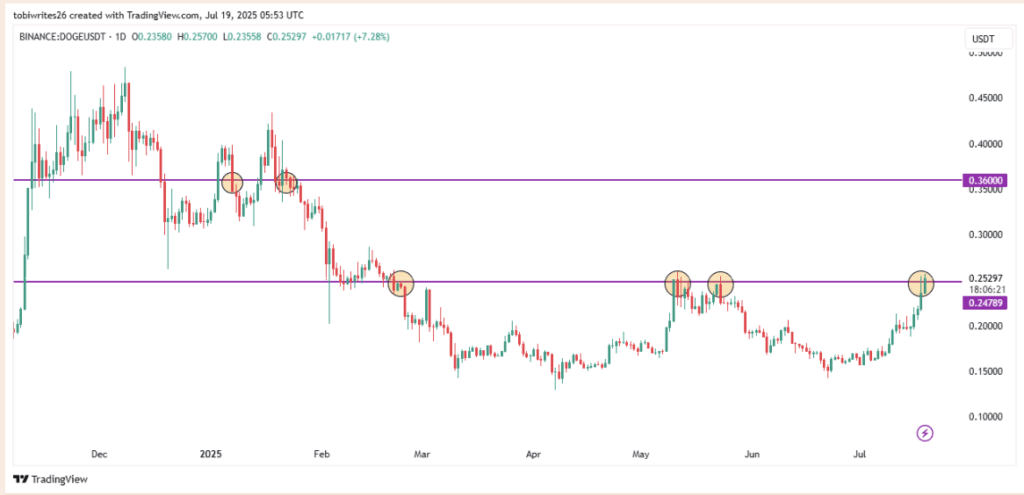
So here’s the thing: even though DOGE popped past $0.20 again, the big resistance wall is sitting up at $0.36. That level has already slammed the brakes on previous runs—twice, actually—and it’s still looming large. Glassnode’s UTXO Realized Price Distribution (fancy name, yeah) basically confirms this. If DOGE heads up there again, history says it’ll hit some turbulence.
Looking at the daily chart, $0.36 has been tough to crack. DOGE tried to push above that mark earlier this year—but it didn’t stick, and what followed wasn’t pretty. That failed breakout back in Jan led to a sharp drop, all the way down to $0.154. Yikes.
More Resistance—Right Here, Right Now
And it’s not just about $0.36. Right now, DOGE is floating above another stubborn resistance point—$0.2478. It’s been rejected there three times before, and this latest push marks the fourth. That’s… not ideal. If it fails again, another leg down might be in the cards. But if it closes solidly above that line, it could actually flip bullish again.
Now let’s talk selling pressure.
Spot Traders Are Offloading—Big Time
According to CoinGlass data, spot traders dumped around $39 million in DOGE over the past day. That’s the largest sell-off since mid-Jan, when almost $590 million was unloaded. Could be people locking in profits. Could also be nerves. Either way, it’s not the most bullish sign.
If these traders keep bailing, DOGE’s price might follow. But hey—if new buyers step in at just the right moment, they could flip the narrative.
Heatmap Shows Tug-of-War Between Buyers and Sellers
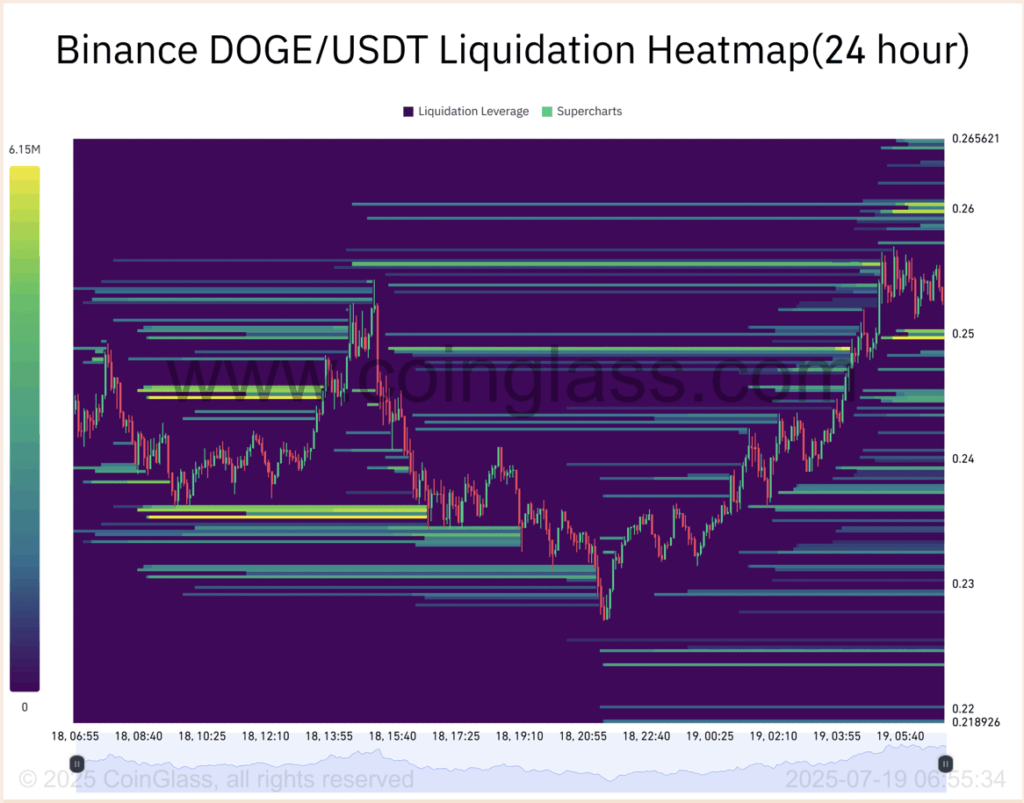
There’s also this: the liquidation heatmap shows two heavy liquidity zones—one above, one below the current price. The upper cluster, between $0.259–$0.260, has about $11.2 million in sell orders. Down below, from $0.250 to $0.249, there’s $11.6 million waiting in buy orders.
What does that mean? Well, it kinda sets up a ping-pong effect. If the price hits the upper zone first, it might get rejected and fall back down to the buyers below. If it dips first, though, that demand could push it back up again. Tricky setup.
Bottom line: DOGE is in a tight spot. Breakout or breakdown—either one could happen. The next few days might be bumpy.