- Dogecoin is testing $0.21 support, with bullish patterns such as a rounding bottom, triangle, and cup-and-handle hinting at a possible breakout.
- Technical signals are mixed: RSI is improving from oversold levels, while MACD stays bearish, making the $0.19–$0.21 zone crucial.
- Strong network fundamentals, including rising hash rate and healthy on-chain metrics, support long-term potential with targets up to $0.54 if resistance breaks.
Dogecoin is back in the spotlight as traders debate whether the meme-inspired token is preparing for another breakout run. After sliding nearly 3% in the past 24 hours, DOGE is hovering close to $0.21, a support level that could determine the next leg of its trend. Analysts note the token’s failure to hold above $0.24 has weakened short-term momentum, but at the same time, several bullish chart patterns are beginning to emerge. These include a rounding bottom, a converging triangle, and even a potential cup-and-handle setup—all structures that historically appear before larger upward moves.
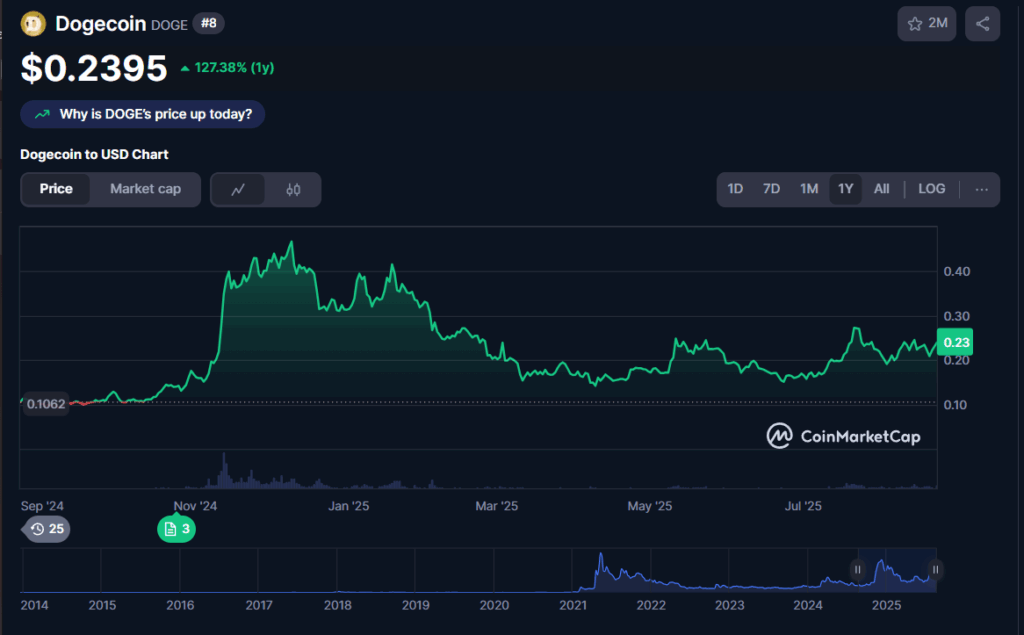
Chart Structures Hint at Reversal Potential
Analyst Zeinab pointed to the rounding bottom pattern forming on recent Dogecoin charts, a signal that often precedes new uptrends. She also highlighted the converging triangle pattern, which reflects declining volatility before a sharp breakout. Meanwhile, analyst Andrew Griffiths identified a cup-and-handle structure, suggesting that a confirmed push above $0.30 could open the door to bigger gains. Traders are watching $0.29 as the immediate resistance zone, with some projections pointing as high as $0.80 if momentum extends into late 2025. That may sound ambitious, but Dogecoin has shown in the past how quickly speculative momentum can snowball.
Mixed Signals From Technical Indicators
The technical indicators for DOGE are painting a mixed picture. The RSI currently sits near 47, just below neutral, but it has been climbing upward from oversold levels, hinting at improving momentum. On the other hand, the MACD remains bearish, with negative histogram bars signaling short-term pressure. Bollinger Bands have widened around the price action, with the middle band around $0.2211 turning into resistance, while the lower band at $0.1924 represents the next downside test if support gives way. Analysts argue that the tug-of-war between these signals makes the $0.19–$0.21 support area critical—holding it could fuel a bounce, while losing it may drag DOGE toward $0.18.
Network Fundamentals Stay Strong
Despite the uncertainty in price, Dogecoin’s network health remains solid. Analyst Alphractal pointed out that hash rate continues to climb, showing miners are confident in the chain’s long-term security. On-chain data also shows steady fees and healthy supply dynamics, suggesting the underlying network is not under stress. Market capitalization currently hovers near $33 billion, with trading volume around $3.4 billion—a sign that liquidity remains decent even in the face of price swings. Valuation models such as CVDD estimate a potential target of $0.54 based on historical patterns of dormant coin movement, offering another data-driven perspective on DOGE’s longer-term potential.
The Road Ahead for Dogecoin
Dogecoin has dropped 17% over the past month, but it continues to attract both retail traders and larger investors who see opportunity in its volatility. Analysts agree that $0.19–$0.20 is the critical floor, while $0.29–$0.30 remains the key resistance ceiling. If the token manages to break above this level with conviction, analysts believe it could spark a rally toward higher targets like $0.38 or beyond. With multiple bullish patterns aligning, strong network fundamentals, and lingering retail enthusiasm, Dogecoin’s next move could set the tone for its trajectory heading into 2025. The only question now is whether buyers have enough strength to flip resistance into support and finally push DOGE toward the levels bulls are eyeing.