
- Dogecoin failed to break above the Ichimoku cloud and continues facing strong resistance.
- The asset remains below all major moving averages, confirming a broader downtrend.
- Key support lies between $0.085 and $0.080, with further downside possible if it breaks.
Dogecoin has been having a hard time regaining upward momentum lately, and the charts are starting to reflect that pretty clearly. Recent market data suggests the meme coin is running straight into technical resistance every time it tries to bounce. On March 7, crypto analyst Trader Tardigrade pointed out a bearish structure forming on Dogecoin’s 4-hour chart, using the Ichimoku indicator as the main reference.
According to the analysis, DOGE briefly attempted to climb higher but couldn’t push above the Ichimoku cloud, which was sitting around the $0.102 to $0.103 range. That rejection triggered renewed selling pressure, sending the price downward again. The setup hints at a possible liquidity sweep before the broader downtrend continues — something that traders often see when markets try to fake a recovery before rolling over again.
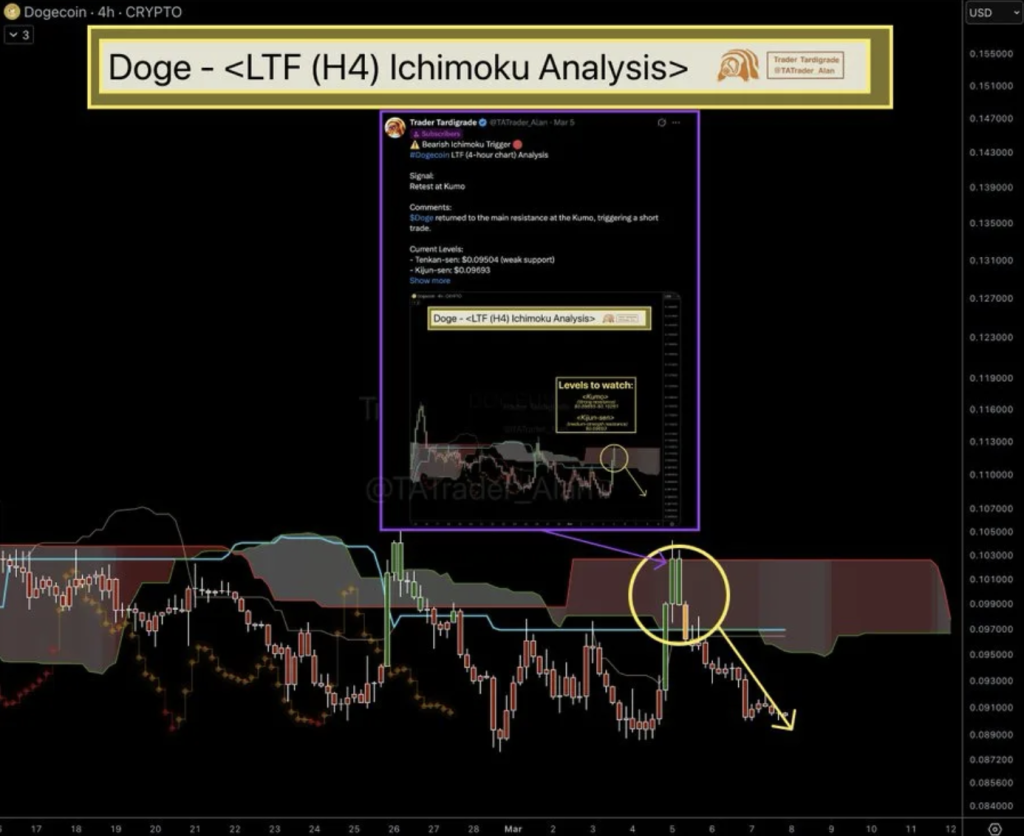
Ichimoku Signals Weak Short-Term Structure
The short-term structure doesn’t look especially strong either. Dogecoin’s price has already slipped below both the Ichimoku Tenkan-sen and Kijun-sen lines, which generally indicates weakening momentum in the near term.
At the moment, the Tenkan-sen near $0.095 is acting as a light layer of support. It’s there, technically, but it doesn’t appear very strong. The Kijun-sen, sitting closer to the $0.096–$0.097 area, represents a slightly more balanced support level from the earlier move before prices started sliding again.
Adding to the challenge, the forward Ichimoku cloud is unusually thick. In technical analysis terms, that usually signals heavy resistance overhead. Unless there’s a sudden surge of buying interest — which hasn’t appeared yet — breaking back above that zone could be difficult.
Daily Chart Shows Broader Downtrend
Zooming out to the daily timeframe makes the broader picture clearer, and not necessarily in a good way for bulls. TradingView data from March 7 shows Dogecoin still moving inside a larger downtrend, something that’s been developing steadily since late last year.
At the time of the analysis, DOGE was trading near $0.0898 and sitting below all of its major exponential moving averages. The 20-day EMA rests around $0.0955, the 50-day EMA near $0.1052, the 100-day EMA roughly $0.1226, and the long-term 200-day EMA stands around $0.1486.
When shorter-term moving averages remain below the longer-term ones, it typically reflects sustained bearish momentum. In other words, both short-term and long-term trends are still leaning toward sellers for now.
Support Levels and Momentum Indicators to Watch
Looking back at recent price action, Dogecoin has been forming a pattern of lower highs and lower lows since November — a classic downtrend structure. Most bounce attempts have stalled right at the moving averages, which now act as resistance rather than support.
The $0.095 to $0.105 range has effectively turned into a key resistance zone. If Dogecoin were somehow able to break through that band, the next logical upside target would likely be the 100-day EMA near $0.122. But until that happens, the market remains cautious.
On the downside, DOGE is approaching an important support area between roughly $0.085 and $0.080. That zone has historically attracted buyers, at least in the short term. If it fails though, the next level to watch sits closer to $0.076 — and breaking below that could accelerate the decline quite quickly.
Momentum indicators also reflect this uncertain environment. The Relative Strength Index currently hovers around 41–42, which places it below the neutral 50 level. That suggests ongoing selling pressure, though the asset hasn’t quite reached oversold territory yet. Meanwhile, the MACD indicator still shows weakness, with the signal line remaining below zero even as bearish momentum appears to be slowing slightly.