
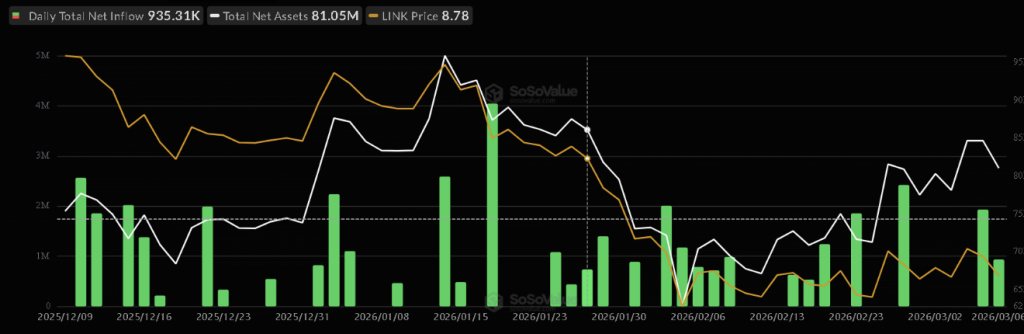
- Chainlink attracted capital inflows while major crypto assets saw outflows.
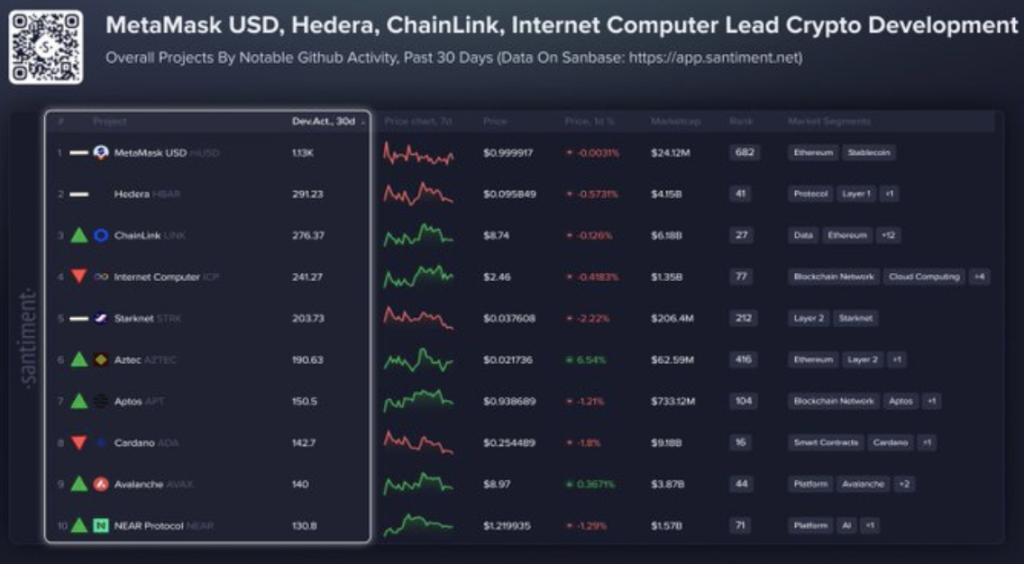
- The project ranked third in development activity across the crypto market.
- LINK is forming an ascending triangle with key levels at $8.30 support and $9.17 resistance.
The crypto market has been looking shaky again lately. Fear tends to move quickly in this space, sometimes faster than conviction, and the past few days have been a good reminder of that. Between March 5 and March 6, capital flowed out of several major crypto assets as traders turned cautious.
Bitcoin, Ethereum, XRP, and Solana all saw money leave the market during that stretch. Prices struggled, sentiment cooled off, and the broader market tone shifted toward risk-off. But Chainlink, interestingly enough, didn’t follow the same path.
Instead of seeing capital exit, LINK actually attracted new inflows. That kind of divergence doesn’t happen often, and when it does, traders usually take notice.
Chainlink Stands Out in Development Activity
Part of the reason Chainlink has remained relevant is its ongoing development activity. According to data from Santiment, the project ranked third in overall crypto development activity over the past 30 days.
MetaMask USD took the top position, while Hedera came in second. Chainlink landing in third place still places it among the few projects consistently showing real building progress.
And that’s important.
In a market filled with noise, attention often shifts toward projects that are actually shipping code and expanding their infrastructure. Many tokens attract hype for a while, but fewer continue producing measurable development work behind the scenes. Chainlink, for the most part, keeps showing up in those metrics.
LINK Records Inflows While Major Assets See Outflows
The story became more interesting once capital flow data entered the picture.
On March 5, Chainlink recorded inflows of roughly 1.93 million. The following day brought another 935,000 in inflows. While those numbers might not look massive at first glance, the context around them matters.
During the same sessions, the broader market saw heavy outflows. Bitcoin, Ethereum, XRP, and Solana all experienced declining investor demand as traders moved funds away from riskier positions.
That contrast stood out. While much of the market struggled to retain capital, Chainlink managed to attract it for two consecutive days. It didn’t spike dramatically — but it also didn’t crack under pressure.
Sometimes, stability alone becomes a signal.
Technical Structure Shows Potential Breakout Setup
Looking at the chart, Chainlink’s price structure also adds another layer to the story. The asset has been forming what appears to be an ascending triangle — a pattern where rising support gradually presses the price toward a flat resistance level.
In this case, resistance sits near $9.17, while the rising support line currently approaches the $8.30 region. As long as that support holds, buyers still have a level they can defend.
Momentum indicators show early signs of improvement as well, though nothing overly strong yet. The Relative Strength Index has started easing upward slightly, suggesting that bearish pressure may be weakening. Meanwhile, the MACD indicator has begun turning marginally positive.
Still, the signals remain tentative.
Chainlink Needs Price Confirmation
This is where the situation becomes interesting. Chainlink has the ingredients that traders often look for — steady development activity, fresh inflows, and a constructive chart pattern. But until price action confirms the setup, the market remains cautious.
If the $8.30 support level fails, the bullish narrative could weaken fairly quickly. On the other hand, a clean break above the $9.17 resistance level would start validating the underlying strength that LINK has shown recently.
For now, Chainlink sits right in the middle of that tension. The signals are there… but the breakout still needs to happen.