
- Cardano Drops 10%, Extending Monthly Decline: ADA has fallen 30% in the past month, now trading at $0.6325, with 123% surge in trading volume indicating heavy selling pressure.
- Technical Indicators Remain Bearish: BBTrend turned positive at 2.83, but remains far below February highs, while the Ichimoku Cloud and EMA signals suggest further downside risk.
- Key Support at $0.50, Resistance at $0.73: If selling continues, ADA could drop to $0.50, but if buyers regain control, potential upside targets are $0.73 and $0.90.
Cardano is in freefall, shedding nearly 10% in the last 24 hours and extending its 30% correction over the past month. Despite the sharp drop, trading volume has skyrocketed 123%, now sitting at $1.4 billion—a sign that market activity is heating up.
This surge in volume likely reflects heavy selling pressure, as traders react to ADA’s volatile price swings. While bearish momentum remains dominant, early signs of a possible reversal are starting to emerge.
BBTrend Turns Positive—But Still Far From Bullish Levels
Cardano’s BBTrend indicator, which measures momentum strength using Bollinger Bands, has moved into positive territory, climbing to 2.83 from -0.90 just a day ago. This shift suggests buying pressure is creeping back in.
While positive BBTrend values hint at bullish momentum, it remains far below February’s peak levels above 10, meaning the current recovery is still fragile. Buyers are stepping in, but they haven’t fully regained control just yet.
If BBTrend continues to rise, it could confirm a strengthening uptrend. However, until it approaches higher levels, ADA remains vulnerable to resistance and potential rejection.
Ichimoku Cloud Signals a Strong Bearish Setup for ADA
The Ichimoku Cloud paints a grim picture for ADA, showing that the downtrend is still firmly in place. Price remains deep below the cloud, signaling continued bearish dominance. The red cloud ahead suggests sellers remain in control, with Leading Span A (green) sitting below Leading Span B (red).
The Tenkan-sen (blue) is positioned below the Kijun-sen (red), further reinforcing the selling pressure. Meanwhile, the Chikou Span (green lagging line) is trailing below the price action, confirming that ADA hasn’t yet found a solid footing for recovery.
For a bullish reversal, ADA would first need to break above the Tenkan-sen and Kijun-sen, then push through the Ichimoku Cloud. Until that happens, downside risks remain high.
How Low Can Cardano Go?
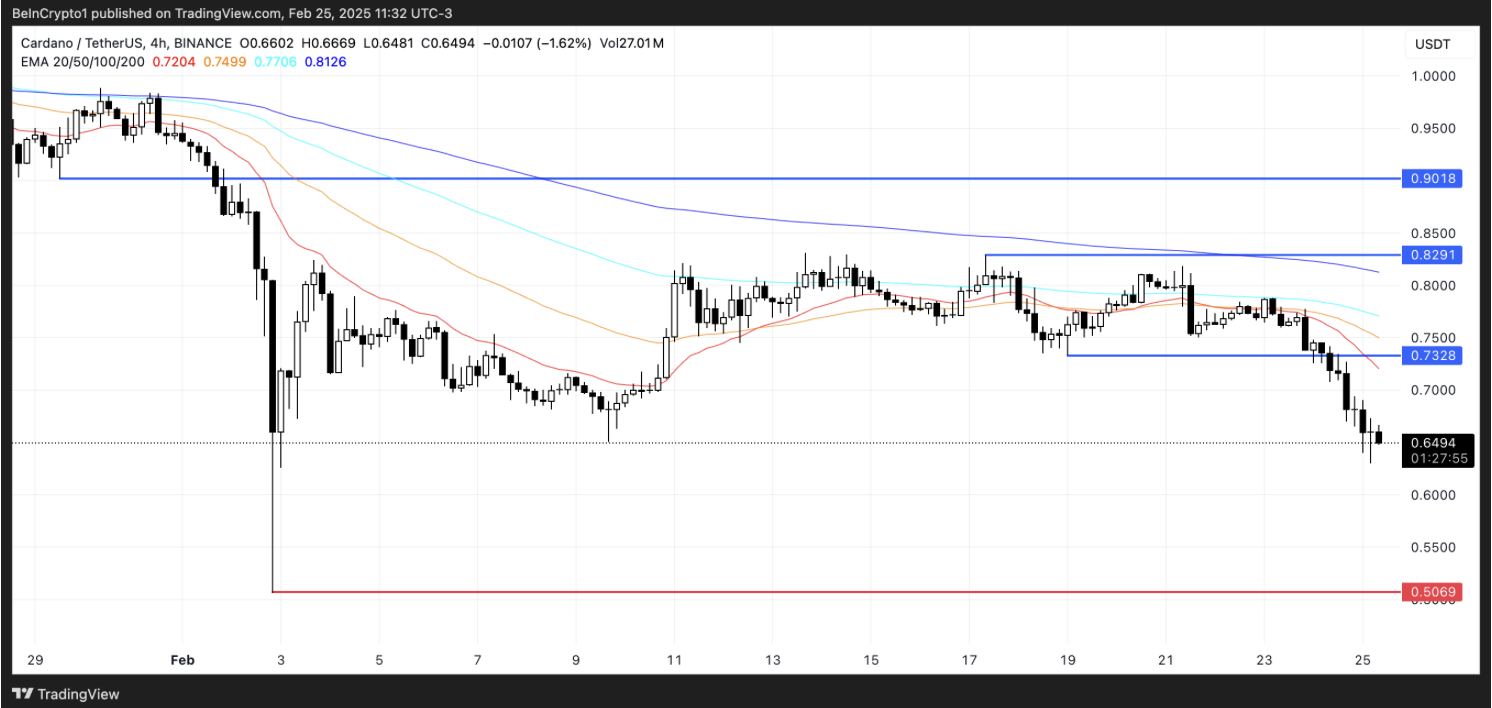
ADA has dropped 18% in just two days, and the Exponential Moving Averages (EMA) confirm a strong bearish trend. Short-term EMAs are well below long-term ones, meaning selling momentum is still dominant.
If this trend continues, ADA could fall further to $0.50. The wide EMA gap shows heavy bearish sentiment, making it difficult for buyers to regain control.
However, if ADA reverses, key resistance levels to watch are $0.73 and $0.82. If these levels break, momentum could shift, potentially pushing ADA toward $0.90—a 40% upside from here.
For any meaningful recovery to happen, short-term EMAs must cross above long-term EMAs, signaling a shift from bearish to bullish sentiment. Until then, ADA remains at risk of further downside.