
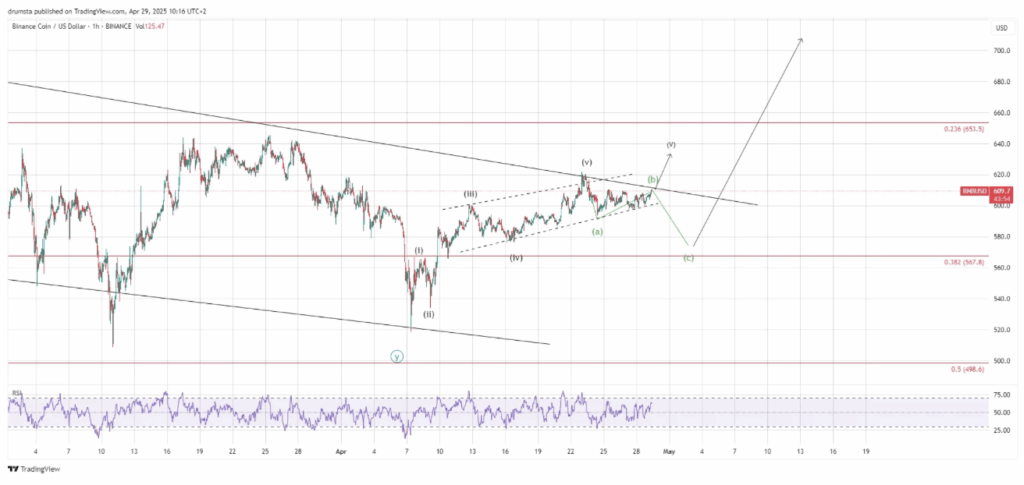
- BNB Nears Breakout Zone: Binance Coin (BNB) is trading near $610, pressing against the top of a long-term descending wedge. A breakout could trigger a rally toward $700–$792, but it needs strong volume and a confirmed daily close above resistance.
- Short-Term Pullback Likely: The intraday chart shows signs of a potential dip into the $580–$600 zone to reset RSI before a larger bullish move. This would offer a stronger setup for a sustained rally.
- Key Levels to Watch: Support sits at $567.8 and $580; resistance stands at $653.5 and $700. A confirmed breakout above $653.5 may ignite bullish momentum, while a fall below $567.8 weakens the bullish case.
Binance’s native token, BNB, is flirting with a breakout. Price action’s been tightening up inside a descending wedge formation that’s been around for quite a while now. And honestly, it looks like things are about to get interesting.
Traders are watching closely as this wedge pattern nears its apex. It’s one of those “any moment now” kind of setups—either we get a clean breakout and bulls go wild, or we see a fakeout followed by a classic dip. Either way, the next few sessions? Gonna be crucial.
Zooming Out: The Daily Chart Story
Let’s start with the bigger picture. BNB hit its all-time high at $792, and since then, it’s been stuck in a corrective phase—a WXY complex correction, to be specific (for the chart nerds out there).
Now, the price is sitting just below the wedge’s upper boundary, right around $610. That’s also where we’ve got a key Fibonacci level—the 0.236 retracement at $653.5, with another major one at $567.8 (0.382 Fib). Coincidence? Not really.
RSI on the daily is also perking up, showing strength but not screaming “overbought” yet. So yeah, the engine’s warming up.
A strong daily close above $610 and ideally pushing past $653.5 could be the spark that sends BNB flying toward $700and maybe even retesting $792. But—and it’s a big “but”—without confirmation and volume? It could all fizzle fast.
The Short-Term Setup: A Little Shakeout First?
Hop down to the 1-hour chart and you’ll notice BNB already made a nice five-wave move inside a smaller ascending channel. But here’s the thing: short-term RSI is getting a little overheated. A bit of a cool-off might be in the cards.
We might see a little (a)-(b)-(c) corrective move next, dipping down into the $580–$600 zone before the next leg up. That pullback wouldn’t be a bad thing—actually, it could be just what bulls need to recharge.
If BNB catches a bounce off that zone, a new impulse wave could launch it straight to $653.5, with potential extension to $700 and beyond. However, a direct blast through resistance is still technically possible—it’s just not the higher probability path right now, given current RSI levels.
Key Levels Worth Watching
- Support zones: $580 (local low), $567.8 (0.382 Fib), and $498.6 (0.5 Fib).
- Resistance levels: $653.5 (0.236 Fib), $700 (psychological), and $792 (all-time high).
- Breakout confirmation: Daily close above $653.5 on big volume.
- Bullish invalidation: A clean drop below $567.8? That’d poke some serious holes in the breakout theory.
- Fractal Watch Zone: Keep an eye on that $580–$600 area—it’s likely where the next big bounce starts.
Final Take
BNB’s been coiling for a while, and now we’re staring down a decision point. With RSI showing life, Fib levels lining up, and price hovering near the wedge’s top—momentum is definitely brewing.
But before we pop champagne, remember: confirmation is key. Watch for volume, candlestick closes, and RSI resets. If things fall into place, BNB could be gearing up for a serious move.
Keep it on your radar.