
- BNB is trading above $762 after a strong 9% weekly gain, closing at its highest-ever weekly level.
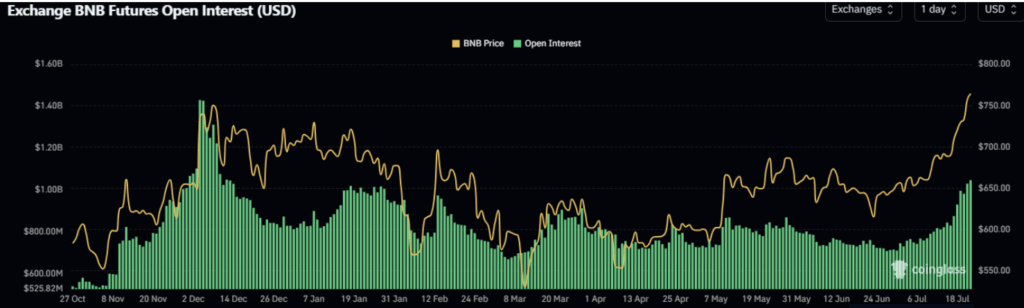
- Open Interest in BNB futures hit $1.05B, showing strong bullish bets and fueling momentum.
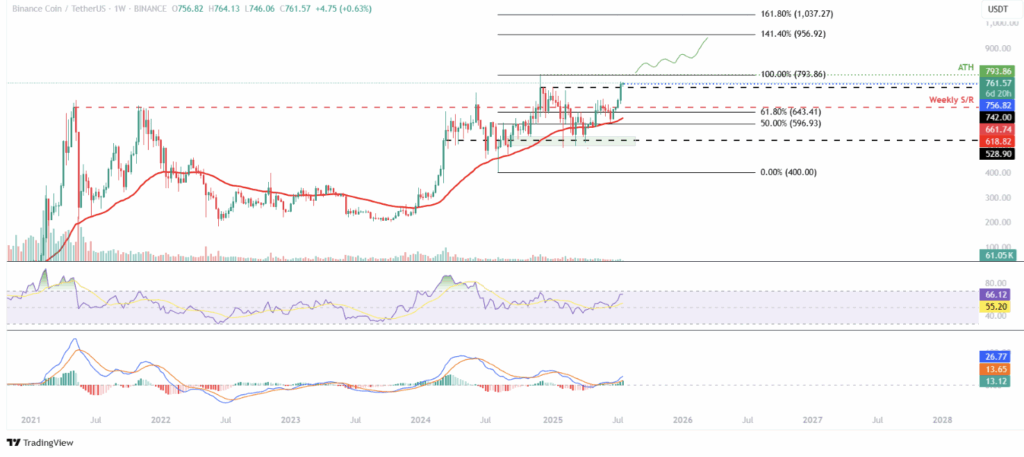
- A push above $793.86 could send BNB into price discovery mode, but RSI warns of short-term overbought conditions.
BNB (yeah, the artist formerly known as Binance Coin) is heating up again. As of Monday, it’s dancing above $762, fresh off a weekly close that marked its highest ever. The token gained over 9% last week, and the signs are stacking up that more upside could be in the cards. Derivatives data is backing the bulls too—Open Interest (OI) just smashed through to a new yearly high.
$1.05B in OI? Someone’s Betting Big
According to CoinGlass, futures Open Interest for BNB has surged to $1.05 billion—up from $829M just a few days ago. That’s not small potatoes. It usually means new money is flowing in and traders are opening fresh long positions. Basically, people are feeling bold.
OI jumping like this tends to pump the price, especially when there’s already momentum in the tank. And right now? BNB’s clearly got fuel to burn.
Can BNB Crack $793 and Fly?
Looking at the weekly chart, BNB’s been on a tear—ripping over 9% to close last week at $756.82, its highest weekly candle yet. And it’s not slowing down. Early this week, price pushed past $760, eyeing that all-time high at $793.86.
If this rally keeps pace and buyers don’t blink, BNB could not only retest that top but break into price discovery. Some bulls are already pointing to a Fibonacci extension at $956.92—yeah, that’s ambitious, but it’s on the map now.
The weekly RSI sits at 66, comfortably above neutral and flashing solid momentum. MACD? Also bullish, with green histogram bars still pushing upward since that May crossover.
Short-Term View: Looking Hot, Maybe Too Hot
On the daily chart, BNB broke out of a falling wedge last week and smashed through $709.29, then made a clean close above resistance at $742 on Sunday. As of Monday, it’s holding above $760.
Here’s the catch though: the daily RSI is at 83, which is deep in overbought territory. That doesn’t guarantee a reversal, but it’s a yellow flag. Still, MACD’s bullish crossover from early July is intact, and those rising histogram bars show buyers aren’t done just yet.
If things do cool down, first support is around $742, and a deeper drop could find footing near $709.29. But if bulls hold the line, this might just be the warm-up for a proper breakout past $793.86.