
- Bitcoin is compressing under $68K–$69K, a classic setup that often precedes a breakout.
- High open interest around $45B suggests the next move could be amplified by liquidations.
- $66.5K–$67K and $64K–$65K remain the key support zones keeping the broader structure intact.
Bitcoin is starting to feel like it’s holding its breath.
Right now, BTC is stuck in a tighter and tighter range just under the $68,000–$69,000 area, and the more it compresses, the more traders start expecting a bigger move. As of February 12, Bitcoin is hovering around $68,030 after several days of sideways grinding. Buyers keep stepping in on dips, but every bounce keeps getting slapped down near the same overhead resistance, which is exactly how these “compression” setups usually look before the market finally picks a direction.
Bitcoin’s Price Structure Is Tightening Under a Key Ceiling
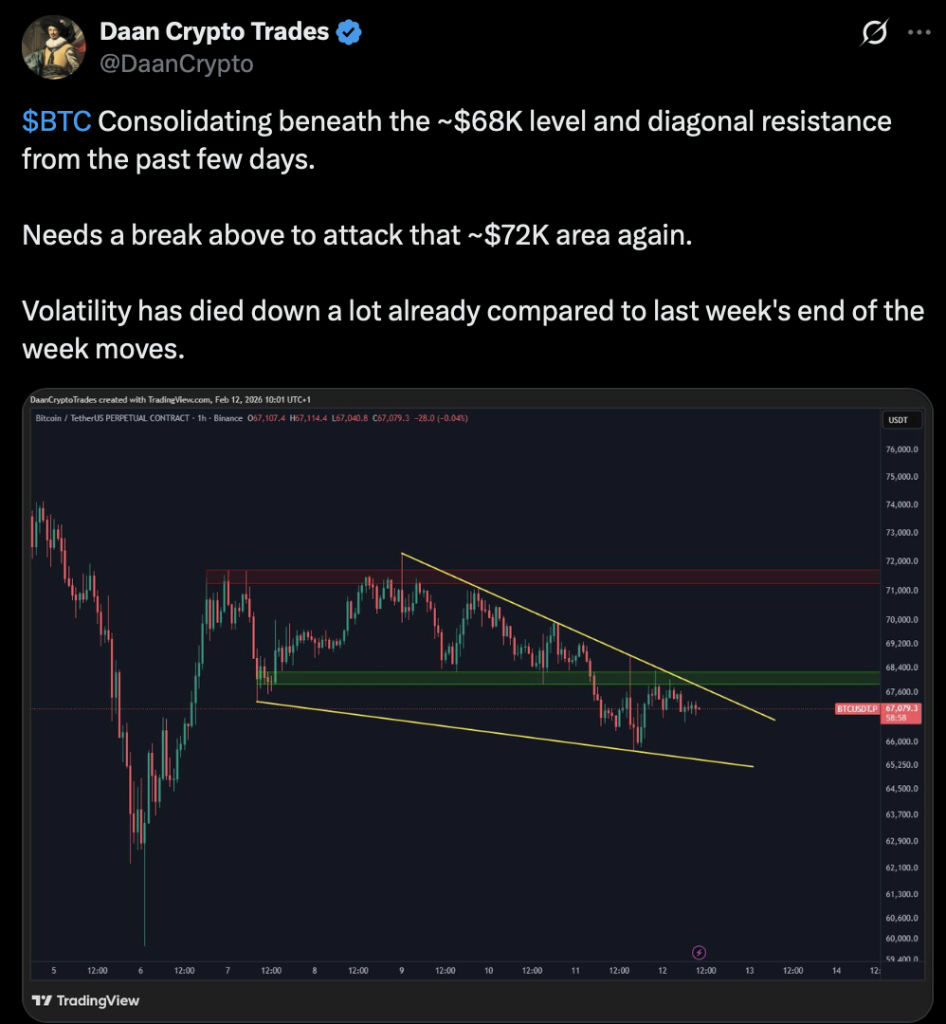
On the lower timeframes, Bitcoin is basically boxed in. The $68,500 to $69,000 zone has acted like a hard cap, with multiple rejection wicks showing up again and again over the past week. There’s also a descending trendline hanging over price, which is making upside follow-through even harder.
At the same time, BTC has been bouncing repeatedly from the $66,600–$67,000 range, creating what looks like a tightening wedge. And wedges like this aren’t “bullish” or “bearish” by default, they’re more like a pressure cooker. It’s equilibrium, not conviction, which is why the price action feels so stale.
Crypto analyst DaanCrypto described it as consolidation beneath a major barrier, saying that a clean break higher could drag price toward liquidity around $72K, while failure could send BTC back toward the $67K support zone. That lines up with what the chart is showing, honestly.
Technically, if bulls want this to be real, they probably need a sustained 4-hour close above $69,000 with volume expanding and open interest rising. Without those confirmations, any pop higher risks fading quickly in thin liquidity, and Bitcoin has been doing that a lot lately.
Futures Positioning Suggests the Next Move Could Get Ugly Fast
One of the bigger reasons traders are watching this range so closely is leverage.
CoinGlass data shows Bitcoin futures open interest sitting around $45 billion as of February 12, which is pretty elevated considering how quiet price has been. That’s important, because high open interest during low volatility periods tends to create fragile conditions. When the move finally comes, it can hit like a hammer.
Even a 2–3% swing during crowded leverage periods has historically triggered huge liquidation cascades. We’re talking hundreds of millions wiped out in forced closes, which pushes price even further than spot demand alone would normally justify.
Some short-term traders are even expecting a quick sweep below $67,000 first, mainly to clear out clustered stop losses. It’s a common pattern after long consolidation phases, especially in bull-market environments where the market loves to “shake out” weak hands before a real move.
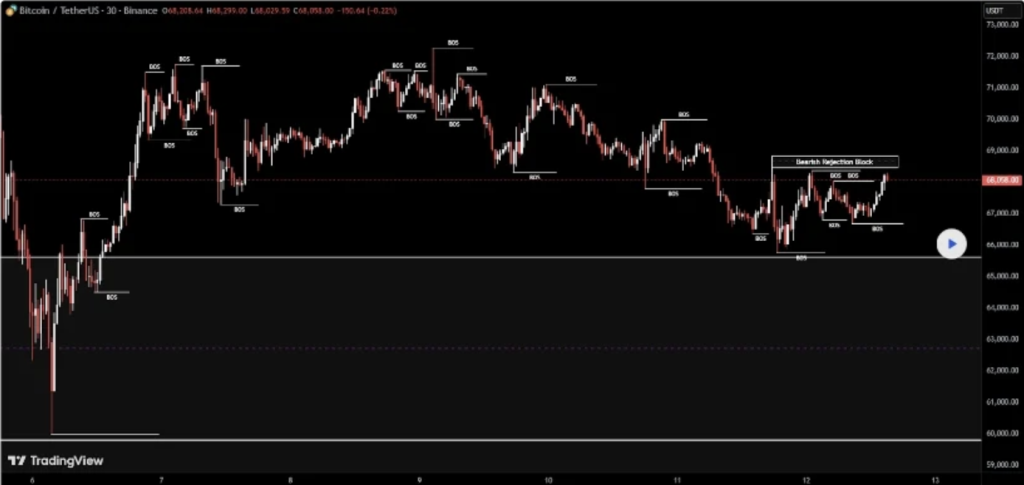
Timeframes Are Fighting Each Other Right Now
On the very short-term charts, Bitcoin looks like it’s trying to stabilize. The 30-minute timeframe shows a rebound of about 2% off the $66,600 low, and volume picked up slightly during the bounce. That’s not nothing.
But the problem is the upside still looks heavy. Resistance near $70,000 continues to attract sellers, and a lot of intraday TradingView setups show this zone acting like a liquidity pocket where price keeps reversing quickly.
Higher timeframes aren’t exactly screaming strength either. Four-hour momentum indicators have flattened out, and several technical summaries are sitting in that awkward “neutral to sell” zone. That’s usually what you see when the market is pausing, not trending. Without stronger participation, rallies can still happen, but they tend to stall before turning into anything sustainable.
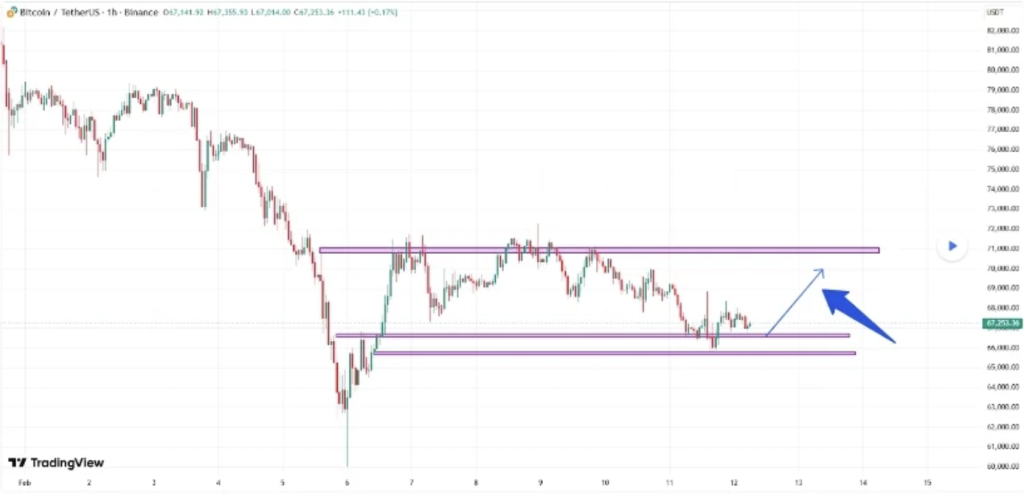
The Levels That Matter Are Very Clear
Bitcoin is rotating between zones that are basically carved out by historical volume and order concentration. The levels aren’t speculative, they’re based on repeated reactions, which is why they keep holding.
The key zones traders are watching:
Immediate resistance: $68,500–$69,000
Upper liquidity target: $72,000
Short-term support: $66,500–$67,000
Range floor: $64,000–$65,000
If BTC gets real acceptance above $69K, it opens the door toward $70K–$72K, where there’s still unfinished liquidity from prior breakdowns. But if price starts living below $66.5K, the odds of a deeper drop into the mid-$60Ks rises pretty fast.
This is the kind of market where one clean break can change everything, but until that happens, it’s still just chop.
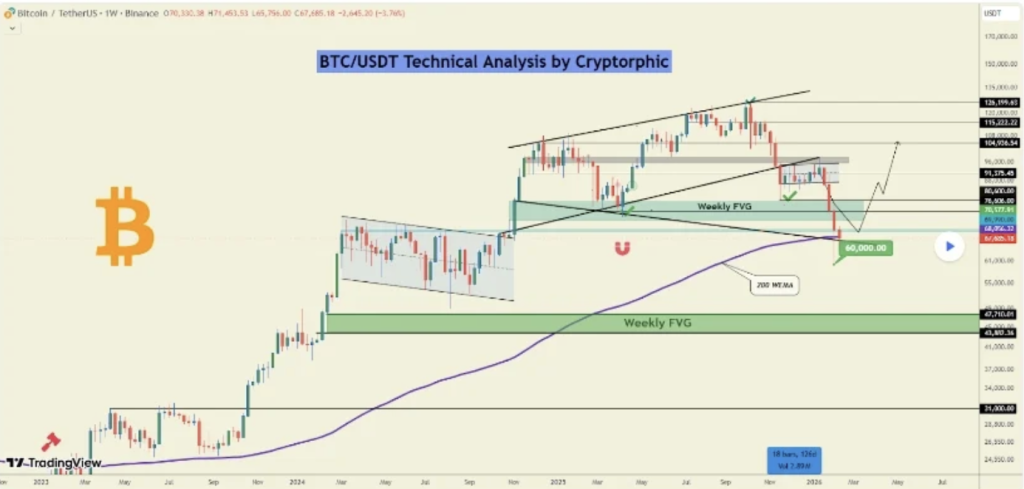
Macro Liquidity Is Still a Quiet Weight on Bitcoin
Macro conditions are still part of the story, even if traders don’t want to hear it.
The U.S. dollar index remains firm, and Treasury yields are sitting near multi-month highs. That’s typically a tightening environment, which historically reduces flows into risk-sensitive assets, including crypto. It doesn’t mean Bitcoin has to crash, but it does mean it’s harder for rallies to sustain without some extra fuel.
That said, there’s still steady accumulation happening in the background. On-chain trackers show wallets holding more than 1,000 BTC (often labeled whales) added around 53,000 BTC over the past month. That suggests longer-term players are positioning strategically, even while short-term sentiment stays cautious.
On top of that, spot Bitcoin ETFs from major asset managers continue absorbing coins on a net basis, creating structural demand. That’s probably one of the main reasons dips into the mid-$60Ks keep getting bought up so aggressively.
So yeah, the macro environment is tighter, but institutional demand is still real. That push-and-pull is basically why Bitcoin keeps rotating instead of trending.
Bitcoin Price Outlook: It’s Conditional, Not Directional
The near-term outlook is still a “wait for confirmation” situation.
Volatility has compressed hard over the past week, and average true range readings have narrowed compared with the bigger swings seen in January. Similar volatility contractions in late 2023 and mid-2024 were followed by breakouts within a few sessions, but the direction only became obvious once volume actually showed up.
The main scenarios look like this:
Holding above $66K keeps recovery potential intact
A confirmed move above $69K–$70K could expose $72K liquidity
A weekly close below $65K would weaken structure and shift risk lower
Until one of those happens, Bitcoin is still in balance, and the market is basically coiled.
Final Thoughts
Bitcoin is stable, but it’s not confident. Support keeps absorbing sell pressure, but upside momentum hasn’t strengthened enough to turn this into a real trend. And that’s why this range feels so frustrating, it’s not moving much, but it’s also not resolving.
Short-term bias remains neutral. The broader structure still looks constructive as long as BTC stays above the $64K–$65K floor. If that floor breaks, it would mark the first meaningful lower low on the daily timeframe, and that would change the whole vibe.
For now, range trading dominates. But with volatility tightening and leverage stacked, this kind of setup rarely stays quiet for long. And as always, Bitcoin price prediction is probabilities, not promises.