
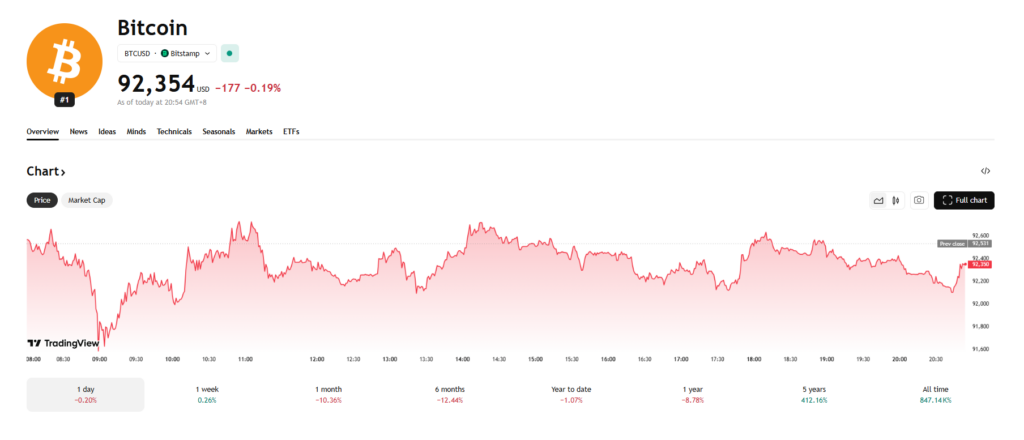
- Bitcoin barely moved after the Fed cut, remaining stuck in a mini rising channel inside a larger downtrend.
- Technicals lean bullish: MACD is close to flipping positive, and the dollar index is weakening.
- A breakout above trendline resistance targets $97K–$108K, while a breakdown risks $80K support.
The Federal Reserve delivered its expected 25bps rate cut, but Bitcoin barely reacted, holding near $92,000 and continuing its unusually stagnant trading pattern. Even with supposedly “hawkish” guidance from the Fed, the U.S. dollar sold off sharply—yet BTC failed to capitalize. This lack of movement has frustrated traders who were expecting volatility, but the structure on the daily chart remains the same: a small rising channel inside a larger downtrend that has defined Bitcoin since its record highs.
Technical Signals Show a Bullish Lean, But No Confirmation
The key trigger remains simple. A breakout above the major bearish trendline may mark the end of Bitcoin’s downtrend, while a breakdown below the mini ascending channel would confirm weakness and expose deeper support near $80,000. For now, the bull case looks slightly more convincing. The medium-term MACD histogram is on the verge of flipping positive—a signal that often precedes renewed upside momentum. The dollar index has also weakened to its lowest level since October, and its own MACD has turned negative, typically a supportive backdrop for BTC.
Macro Markets Look Supportive, but ETF Flows Remain a Drag
Equities are stabilizing, with the Nasdaq now trading above its 50-, 100-, and 200-day moving averages—a historically bullish signal for risk assets. Even so, Bitcoin’s correlation with tech stocks has become asymmetric: BTC falls hard when Nasdaq dips, but climbs only modestly during rallies. ETF flows are another headwind. Not a single day in the last month has seen more than $500 million in net inflows, and cumulative flows since late November are just $219 million, a fraction of the massive redemptions seen earlier in the fall. Until ETF demand returns, upside momentum will struggle.
What Comes Next: Key Levels and Possible Scenarios
Should BTC break higher, multiple layers of resistance await between $97,000 and $108,000, including major moving averages and the Ichimoku Cloud. Sellers appear exhausted for now, but a failure to break upward could shift momentum quickly. A decisive breakdown from the mini ascending channel would reinforce the broader downtrend and open the door to a retest of the $80,000 region. With Bitcoin stuck between conflicting signals, the next clean breakout—up or down—will likely define its direction into early 2026.