Bitcoin or gold? Which one is the best hedge against inflation and extreme price volatility? This debate may become increasingly pointless as the correlation between the two assets continues to tighten.
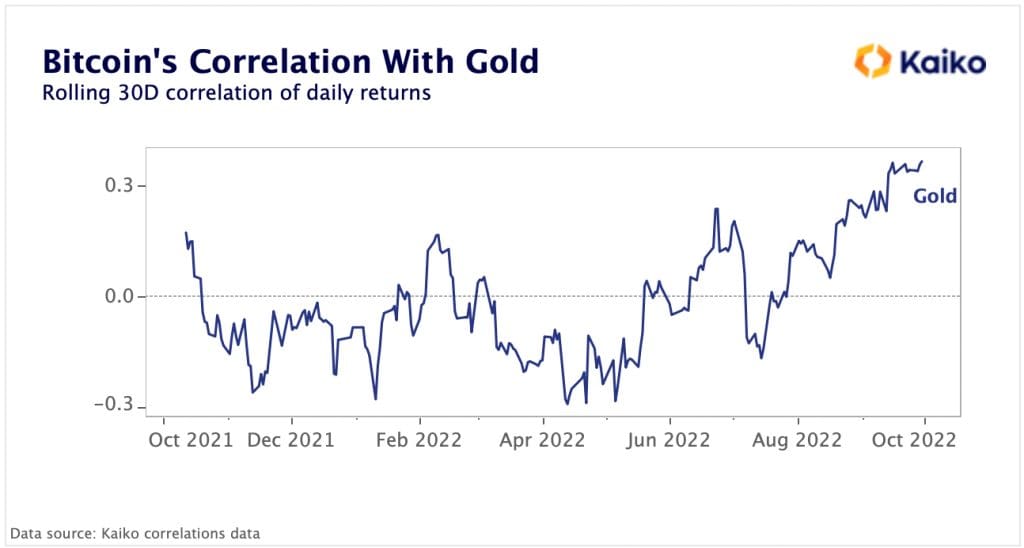
The correlation rate between Bitcoin and gold, computed on a monthly average, hit its highest level in over a year at 0.3 in Q3/2022, surpassing the peaks of Q1/2022 and Q2/2022, crypto market analytics platform Kaiko Data stated in its data debrief published on October 3.

Gold Has Failed As A “Safe-Haven Asset”
According to Kaiko analysts, the big crypto and the world’s most precious metal have suffered significant drops this year. Kaiko’s debrief claims that the Russia-Ukraine conflict, which escalated into a full-scale war in March, triggered a notable uptrend in gold. At that time, most financial assets crashed, with cryptocurrencies and stocks recording some of the most significant losses.
“After benefiting heavily from the Russia-Ukraine conflict in the first quarter of the year, gold has lost all its gains and is currently down 10% YTD. This year, Bitcoin has also declined double-digits, dragged down by global monetary policy tightening.”
Moreover, in the wake of persistently high inflation rates and fears that the world’s major economies might be on the brink of recession, the Kaiko report states that “gold has failed to act as a safe-haven asset, i.e., an asset that is expected to retain or gain in value during periods of economic downturn.”
It should be noted that central banks have been consistently raising interest levels in the wake of “core inflation remaining persistently high.” However, regulators worldwide have failed to keep inflation in check despite a series of tightening monetary policies.
It is expected that gold, as a safe asset, should act as a store of value during periods of high price volatility, inflation, and depreciating values of fiat currencies.
Bitcoin has primarily remained uncorrelated with gold. Over the past year, the correlation between the two assets has “oscillated between negative 0.2 and positive 0.2”. According to standard statistical practices, a correlation coefficient of 0.2 or below should be disregarded. However, with the strengthening dollar, Bitcoin and gold have weakened, leading to an increased correlation between the two assets, as reported by Kaiko Data.
“Over the past year, Bitcoin has been mostly uncorrelated with gold, with its correlation oscillating between negative 0.2 and positive 0.2. However, the correlation between the two assets has shifted as the U.S. Dollar continues strengthening, negatively impacting both crypto and gold.”
Bitcoin Price Action
At press time, Bitcoin traded at $20,140, up 0.11% on the day. At the same time, the global crypto market capitalization has grown by 0.51% to $964.73 billion. BTC price is up 3.64% compared to the previous seven days, with a market dominance of 40.03%, according to data from CoinMarketCap.
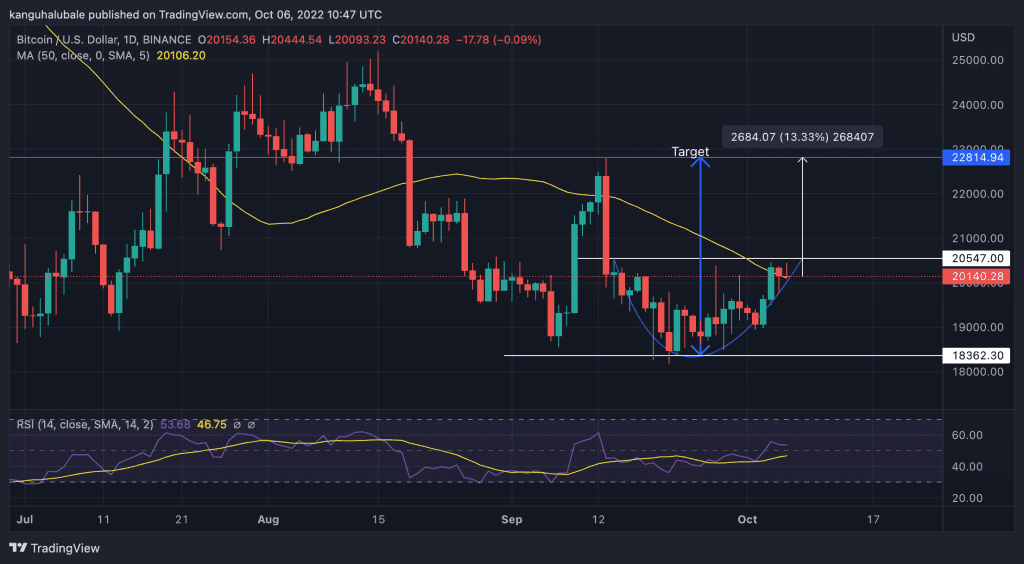
BTC price technical outlook predicts a bullish momentum for the flagship cryptocurrency following the appearance of a rounded bottom chart pattern on the daily chart. This is a highly bullish formation projecting a 13.33% recovery for BTC from the current price.

This upswing will be achieved after bulls break the $20,550 resistance zone and the $22,000 psychological level. If this happens, a rise to the September 13 range high of around $22,800 would be the next logical move representing a 13.33% ascent.
Bitcoin’s optimistic outlook is validated by the price trading above the 50-day simple moving average (SMA), sitting at $20,106, which is providing bulls with immediate support. In addition, the relative strength index (RSI) is positioned in the positive region at 53, suggesting that the market still favors the upside.
On the downside, if Bitcoin produces a daily candlestick below the 50-day SMA, it would indicate weakness amongst buyers. This would see the current bearish candle extend to $19,00 0 and later to the pattern’s bottom around $18,360.


