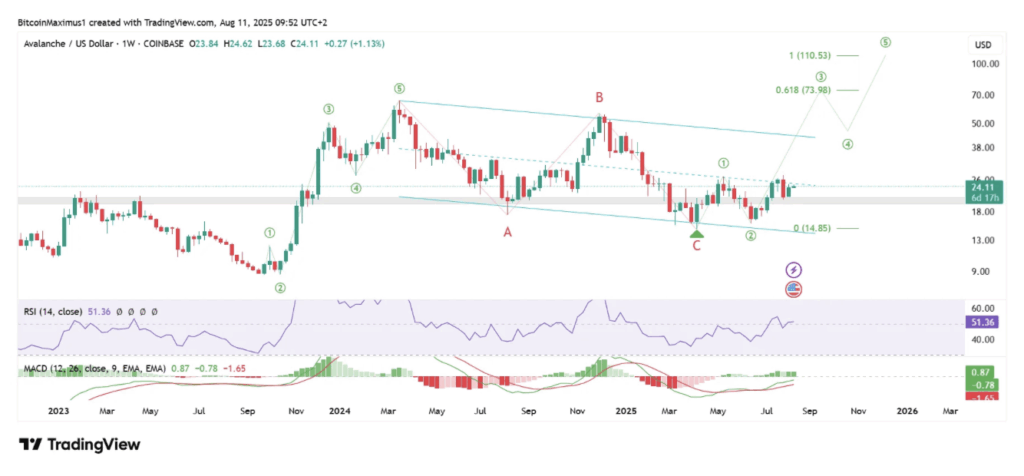
- AVAX is testing the $26 resistance, with a breakout potentially opening targets at $74 and $110.
- Weekly chart shows an A-B-C correction may be complete, while daily chart reveals a bullish 1-2/1-2 wave structure.
- A confirmed close above $26 could kick off a rapid August rally, mirroring recent surges in PENDLE and LINK.
Avalanche (AVAX) is inching toward a make-or-break point at $26 — a level that could unlock a surge toward $74 or even $110 if bulls get their way. The setup isn’t just random; the wave count mirrors recent explosive moves seen in PENDLE and LINK, hinting that something big could be brewing here.
Weekly Chart Signals a Shift
Looking at the weekly chart, AVAX has been stuck inside a descending parallel channel since its March 2024 cycle high. A strong bounce in April pushed it back above $20, flipping that zone into likely support. The catch? Price is still hovering just under the channel’s midline. The bullish wave count suggests a long A-B-C correction might be over, meaning an upward leg could be next. But it all hinges on a close above $26 — that’s the technical green light. Momentum is close to tipping too, with RSI sitting at 50 and MACD barely shy of turning positive.
Daily Chart Looks Even More Bullish
On the daily timeframe, the structure is screaming strength. AVAX appears to be in a rare 1-2/1-2 wave formation, a setup that tends to precede fast, aggressive moves. If this read is correct, we’re entering sub-wave three — often the steepest part of the rally. Unlike the weekly chart, daily momentum is already bullish, with RSI above 50 and a fresh MACD bullish cross.
August Could Be AVAX’s Launchpad
If bulls can secure a solid close above $26, the path could be open for a parabolic climb, with $74 and $110 as realistic targets for this cycle’s top. With both daily and weekly charts aligned and momentum building, AVAX might just be on the edge of a breakout that traders will be talking about for months.