
- AVAX is testing the lower boundary of a multi-year descending triangle near $8.60.
- Futures volume and open interest are declining, signaling reduced leveraged participation and cautious sentiment.
- Technical indicators show AVAX remains in a broader downtrend, with the next move dependent on whether long-term support holds.
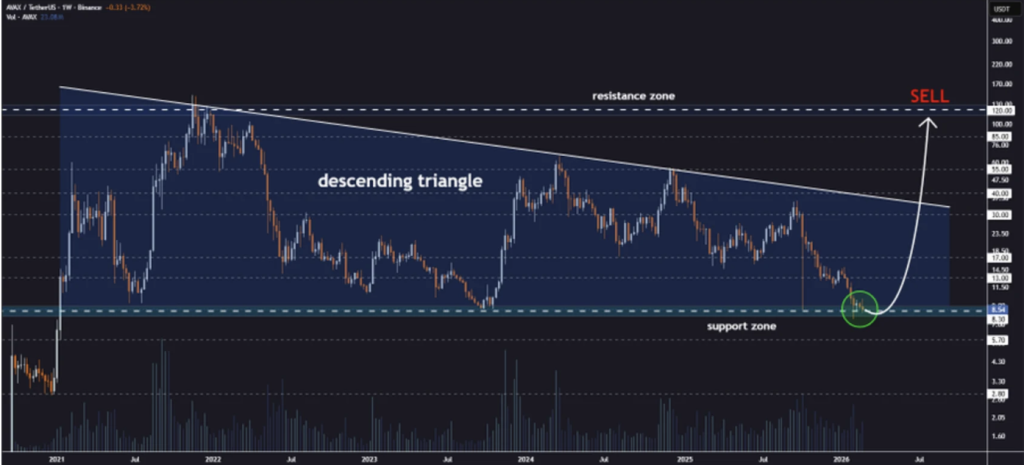
Avalanche is hovering near one of those levels traders circle and underline on their charts. On the weekly timeframe, AVAX is pressing against the lower boundary of a long-standing descending triangle — a structure that’s been shaping price action for years now. It’s not a random line. It’s a level that’s been tested multiple times, and so far, it has held.
As of Saturday, February 28, AVAX trades around $8.64, down roughly 4% on the day. Weekly losses sit near 7%, and trading volume has slipped slightly to about $341 million. Nothing dramatic in isolation. But when price compresses near multi-year support, every percentage point starts to matter a bit more.
Long-Term Support Still Intact, For Now
Crypto analyst Jonathan Carter pointed out that AVAX continues to defend the base of this descending triangle, a support zone that dates back to 2021. That’s a long memory for a market. And each retest strengthens the importance of the level — until it doesn’t.
If the structure stabilizes and buyers step in decisively, the upside roadmap gets interesting. Carter outlined potential targets at $13, $17, $30, $40, $55, $85, and even $120, assuming resistance levels are cleared and momentum builds. That’s a wide range. It reflects conditional progression rather than a straight-line forecast.
But here’s the catch: none of those upside levels matter unless this base continues to hold. Multi-year support can act like a springboard. Or it can snap.
Derivatives Activity Cools Off
Meanwhile, futures markets show signs of cooling participation. According to CoinGlass, derivatives volume dropped over 7% to roughly $549 million, while open interest slid nearly 6% to $362 million. That tells a simple story — leveraged traders are reducing exposure.
The OI-weighted funding rate sits slightly negative at -0.0063%. That suggests mild bearish bias among derivatives participants. Nothing extreme. Just cautious positioning.
When open interest declines during weakness, it often signals traders stepping aside rather than aggressively doubling down. It’s a quieter form of bearishness.
Technical Structure Remains Heavy
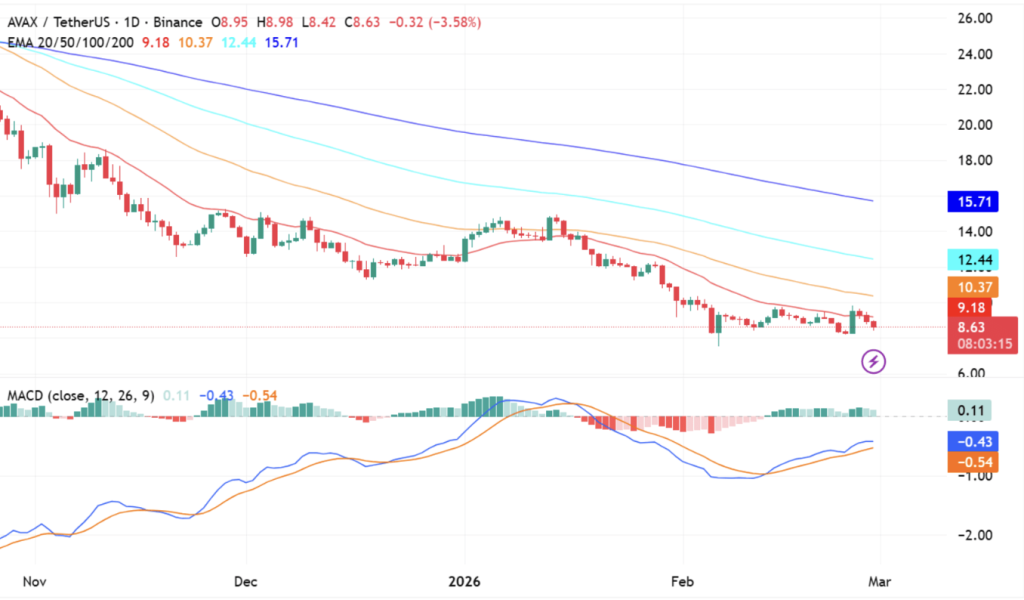
From a trend standpoint, AVAX is still below all major exponential moving averages. The 20-day EMA sits near $9.18. The 50-day at $10.37. The 100-day around $12.44. And the 200-day EMA hovers higher at $15.71.
Price has remained beneath these levels for an extended stretch. That’s not a sign of strength.
The MACD line prints at -0.43, with the signal line at -0.54, and a slightly positive histogram reading around 0.11. That small histogram improvement hints at slowing downside momentum — but it doesn’t confirm reversal. It’s more like a pause inside a broader downtrend.
AVAX is sitting at a decision point. A level that has defined its multi-year structure is once again under pressure. If support holds, the rebound narrative gains credibility. If it fails, the technical damage could extend deeper.
Right now, the chart isn’t shouting. It’s waiting. And markets rarely stay quiet at levels like this for long.