
- Avalanche sits inside a multi-year wedge near a 4-year support cluster, hinting at a possible long-term accumulation area.
- Crypto Patel’s chart notes repeated retests and deep compression, with potential upside targets based on historical structure.
- AVAX remains down nearly 90% from its peak, and this zone has become a key area traders are watching for any sign of expansion.
Sometimes a chart doesn’t shout… it just kind of hums in the background, giving off small clues long before a real move even thinks about forming. Avalanche sits in one of those calm pockets right now, where price action slows down just enough for the pattern to start making more sense. Crypto Patel shared a chart on X that blends long-term structure with a tight support cluster, almost like a market narrative inching toward a turning point. Each candle seems to push closer to a zone that has held firm for years, hinting that something might be brewing under the surface.
A rare support cluster built from multiple long-term signals
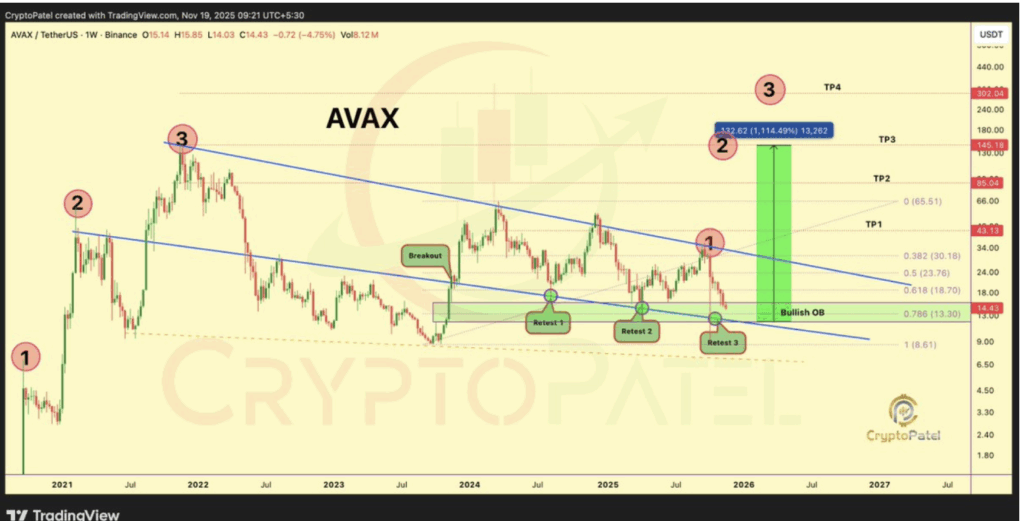
On Patel’s chart, AVAX is tapping what he calls a final accumulation zone—basically the place where long-term buyers tend to reappear if the market is still healthy beneath the noise. A 4-year support level, the 0.786 Fibonacci retracement, and the bottom of a multi-year wedge all stack together in this same area. Setups like this don’t form by accident, and price has returned to this zone several times over the last year, almost like it keeps checking the floor to make sure it’s still solid. Avalanche is already down about 90% from its 2021 peak, and Patel marked $15 to $11 as a potential region for anyone studying accumulation patterns—zones where larger players sometimes start quietly rebuilding positions.
Wedge retests reveal a slow but steady fight between buyers and sellers
Patel’s chart highlights three clear retests of this zone. The first retest confirmed the wedge boundary, the second reinforced it again, and the third pulled price right back into the same liquidity pocket created earlier in the cycle. It gives the chart a sort of push-and-pull storyline—sellers drove price down, buyers defended, sellers made another attempt, buyers stepped back in. Now price is sitting at the very same floor once more. This kind of repetitive testing often hints that a base is forming, especially when the broader market still feels uncertain or kinda burnt out.
As the wedge tightens, the compression usually builds pressure that eventually forces a breakout. AVAX sits near the lower edge of this multi-year wedge, and Patel’s chart lays out projected targets far above—around $43, $85, $145, and even $302. These aren’t guarantees, just technical projections pulled from historical levels and past structure. But a breakout from a multi-year wedge rarely happens quietly; it typically follows long stretches of sideways drifting, emotional dips, or slow declines… all things Avalanche seems to be living through right now.
AVAX sits deep below its peak as traders look for accumulation clues
Avalanche trades far below its old highs, and when a token falls this much, the chart often becomes more interesting than the sentiment surrounding it. Patel emphasized that the current zone aligns with a long-term viewpoint rather than short-term noise, which is why so many traders keep revisiting the setup. Price hovering near $14.42 puts AVAX at a steep discount compared to its peak, and that alone is enough for analysts to start re-examining multi-year structures. When price compresses into a tight corner of a long-term pattern like this, patience becomes the most important piece of the puzzle.
Patel’s projection box shows a potential move expanding upward from the wedge floor toward the higher target zones, all mapped from historical structural points. Traders familiar with Fib levels and multi-year trend lines will recognize this approach instantly. AVAX has been drifting inside this wedge for a long while, tagging the same structure again and again. Patterns like this tend to split opinions—some traders see a risky trap, others see opportunity slowly building. And honestly, the chart leaves enough space for both readings to feel valid right now.