

- Solana gained more than 14% last week, with strong ETF inflows, rising on-chain activity, and improving derivatives data supporting the uptrend.
- Institutional interest is showing signs of returning as U.S. spot Solana ETFs recorded fresh net inflows.
- SOL now faces major resistance near its 100-day EMA, where a breakout could pave the way for another leg higher.
Solana is taking a breather after an impressive rally, but the broader picture still appears constructive.
After climbing more than 14% last week, SOL has eased slightly, trading around $80.89 on Monday. While the token has stalled below an important technical resistance level, several market indicators continue pointing toward growing bullish momentum.
Institutional inflows are picking up, derivatives traders are becoming more active, and on-chain activity keeps expanding. Put together, they suggest the recent rally may not be over just yet.
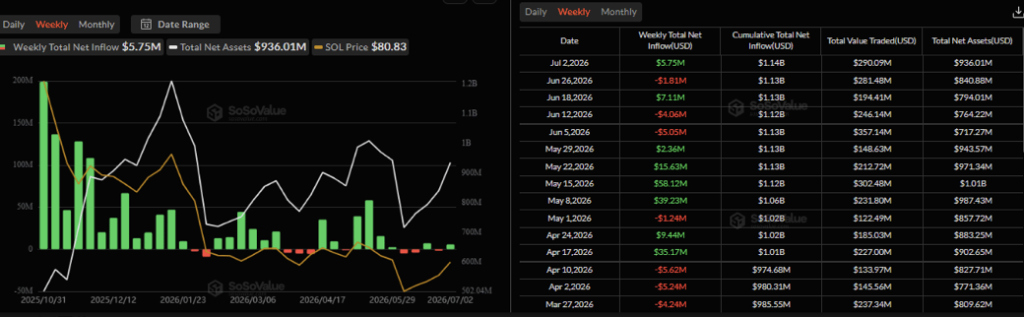
ETF Inflows Signal Renewed Institutional Interest
One encouraging development comes from the spot ETF market.
According to SoSoValue, U.S.-listed spot Solana ETFs attracted approximately $5.75 million in net inflows last week. That marks a notable turnaround after the previous week saw roughly $1.81 million leave the funds.
Although the amounts remain relatively modest compared to Bitcoin or Ethereum ETFs, the reversal could indicate institutions are slowly rebuilding exposure to Solana.
If those inflows continue gaining momentum over the coming weeks, they could provide another tailwind for SOL’s price.
On-Chain Growth Continues to Accelerate
The Solana network is also showing healthy signs beneath the surface.
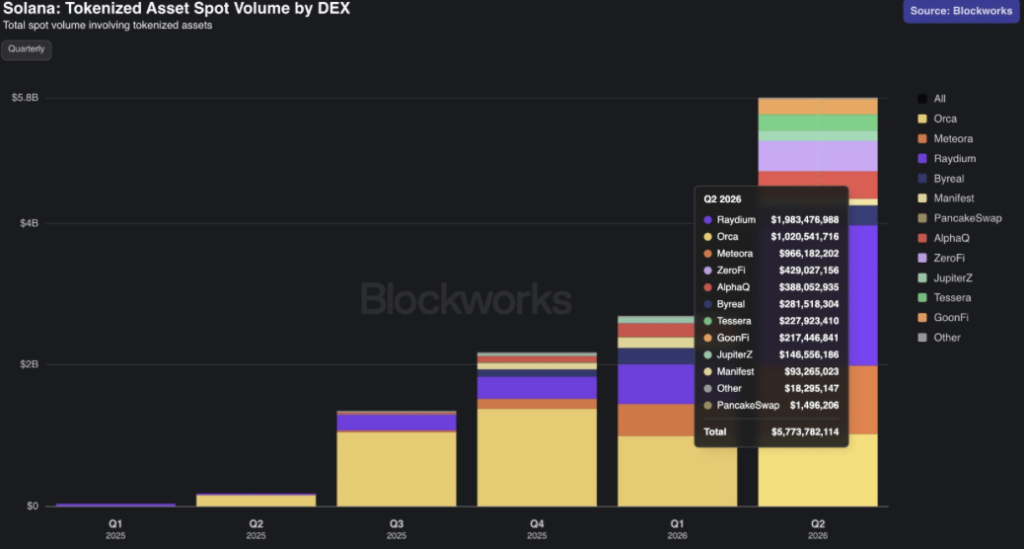
The project’s official X account revealed that tokenized asset spot trading volume reached $5.7 billion during the second quarter, more than doubling from $2.69 billion recorded in the first quarter.
That’s a sizeable jump.
Growing tokenization activity often reflects increasing adoption from developers, institutions, and users building on the network. Combined with stronger transaction activity, it paints a picture of an ecosystem that continues expanding despite broader market uncertainty.
CryptoQuant data adds to the optimistic outlook.
While overall market conditions remain fairly balanced, analysts noted that both the spot and futures markets have recently seen larger whale-sized orders, suggesting bigger investors are becoming more active again.
Derivatives Data Points to Rising Bullish Confidence
The derivatives market is telling a similar story.
Solana’s futures open interest climbed to roughly $5.8 billion over the weekend, the highest level since the middle of May, before easing slightly to around $5.58 billion on Monday.
An increase in open interest generally signals fresh capital entering the market rather than existing positions simply changing hands. When accompanied by rising prices, it often reflects growing investor participation.
Funding rates have also shifted back into positive territory.
According to CoinGlass, SOL’s funding rate turned positive over the weekend and was sitting near 0.0081% on Monday. That means traders holding long positions are paying those betting against the market, typically a sign that bullish sentiment is strengthening.
Technical Picture Remains Constructive
From a chart perspective, Solana still has an important hurdle to clear.
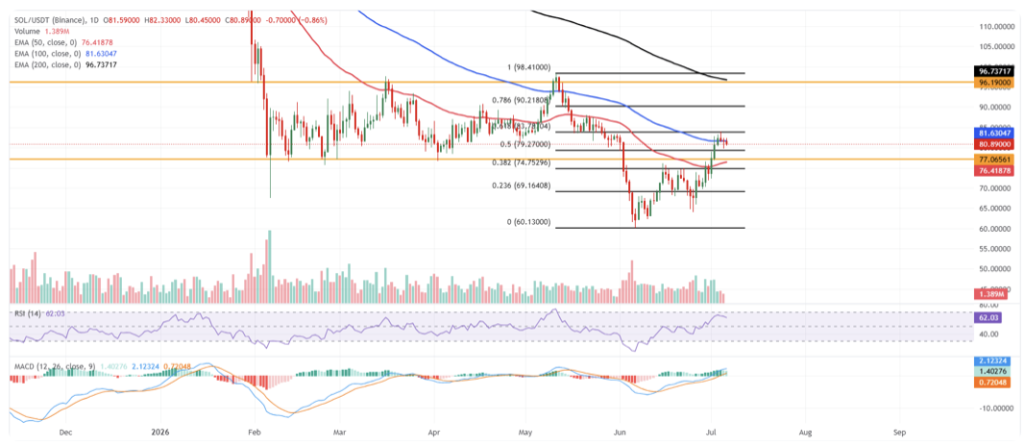
SOL is holding above its 50-day exponential moving average near $76.41 while continuing to trade above the 50% Fibonacci retracement level around $79.27. Those areas now serve as important support.
At the same time, price continues struggling beneath the 100-day EMA near $81.63, which has become the market’s immediate resistance.
Momentum indicators remain encouraging without showing signs of overheating.
The Relative Strength Index is hovering in the low 60s, suggesting buyers still have control while leaving room for additional upside. Meanwhile, the MACD remains firmly in bullish territory, reinforcing the improving momentum.
Breakout Could Open the Door to Higher Targets
If buyers manage to push SOL above the 100-day EMA and the nearby 61.8% Fibonacci retracement around $83.78, the next upside targets begin to come into view.
Technical resistance sits around $90.21, followed by the horizontal barrier near $96.19 and the closely aligned 200-day EMA around $96.73.
On the downside, the first area traders are likely to monitor is support near $79.27. Below that, additional buying zones sit around $77.06 and the 50-day EMA at roughly $76.41.
Should those levels fail, SOL could revisit deeper support around $74.75, followed by the Fibonacci levels near $69.16 and $60.13.
Bulls Still Hold the Advantage
After last week’s sharp rally, a short pause isn’t unusual.
More importantly, Solana continues to benefit from improving institutional interest, expanding on-chain activity, stronger derivatives positioning, and technical momentum that remains tilted in favor of buyers.
As long as SOL holds above its key support levels, the current consolidation may simply be setting the stage for another attempt to break above the 100-day EMA and continue its recovery.