- Solana has climbed back above $70 as trading volume and market activity accelerate.
- A short-term sell signal has emerged near the critical $75 resistance zone.
- Strong ETF inflows and rising network activity continue supporting Solana’s broader bullish outlook.
Solana has managed to regain some momentum, climbing back above the $70 level as the broader crypto market shows signs of life. At the time of writing, SOL is trading roughly 2% higher over the past 24 hours, while daily trading volume has surged more than 20% to around $2.2 billion.
The recent rally didn’t happen out of nowhere. Last week, a TD Sequential buy signal appeared on the chart, helping fuel an 8% move from roughly $68 to $74. That recovery gave bulls something to cheer about after weeks of uncertainty.
Still, the road ahead may not be entirely smooth.
While the rebound has been impressive, technical indicators are beginning to flash warnings that Solana could face some turbulence before attempting another breakout.
Solana Faces Heavy Resistance Near $75
As SOL pushes higher, it is running directly into one of the most important resistance zones on the chart.
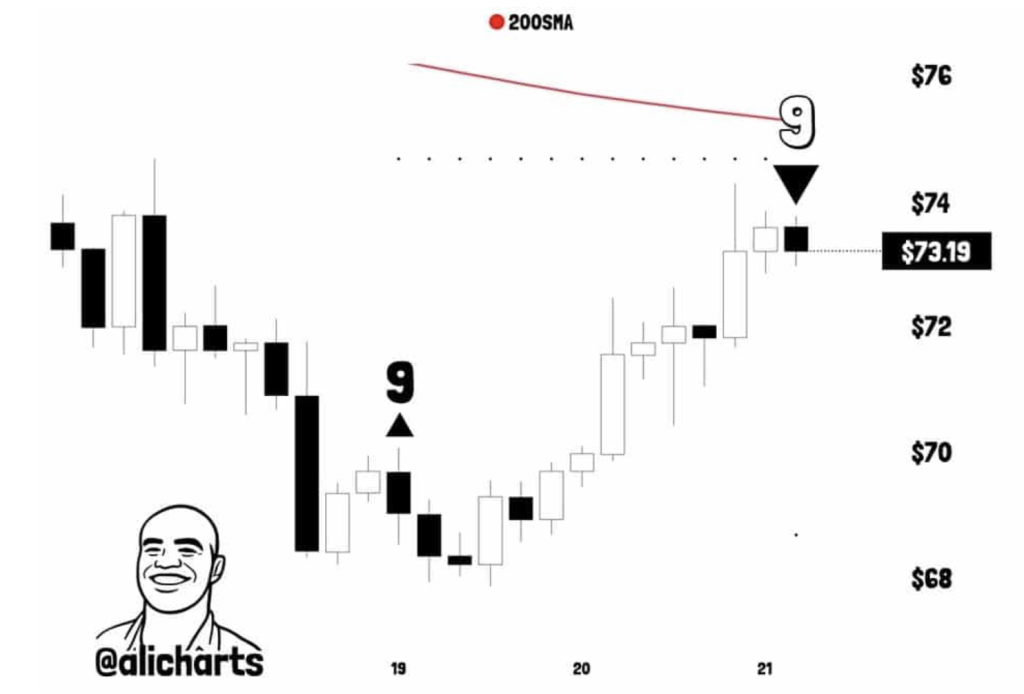
The $75 area has become a significant obstacle for buyers, and several technical indicators suggest sellers are actively defending that level. According to analysts, the TD Sequential has now flashed a sell signal on the four-hour timeframe just as Solana tests a descending resistance trendline.
That alone might not be enough to trigger a reversal. However, the situation becomes more interesting because this resistance area also aligns closely with the 200-period Simple Moving Average.
When multiple resistance levels converge in the same region, traders tend to pay attention.
It’s often where momentum slows down, at least temporarily.
A Short-Term Pullback Remains Possible
Because of this resistance cluster, some analysts believe Solana could experience a modest correction before attempting another move higher.
A pullback toward $72 would not be surprising. In fact, some traders are even watching for a deeper retracement if selling pressure increases over the next few sessions.
That said, a short-term dip would not necessarily damage the broader recovery structure.
Markets rarely move in straight lines, especially after a sharp rally. Small pullbacks often help reset momentum and allow new buyers to enter the market at more attractive levels.
For now, the key question is whether support can continue holding if profit-taking emerges near resistance.
Solana Continues to Outperform Ethereum
Despite the caution appearing on shorter timeframes, Solana’s broader outlook remains relatively strong.
Some market observers have even pointed out that SOL has recently shown more resilience than Ethereum. That relative strength has been reflected in both investment flows and network activity, two areas where Solana continues to stand out.
While price charts may occasionally signal weakness, underlying fundamentals tell a slightly different story.
And that’s where things get interesting.
ETF Inflows Return to Positive Territory
One of the clearest signs of renewed confidence comes from Solana-related investment products.
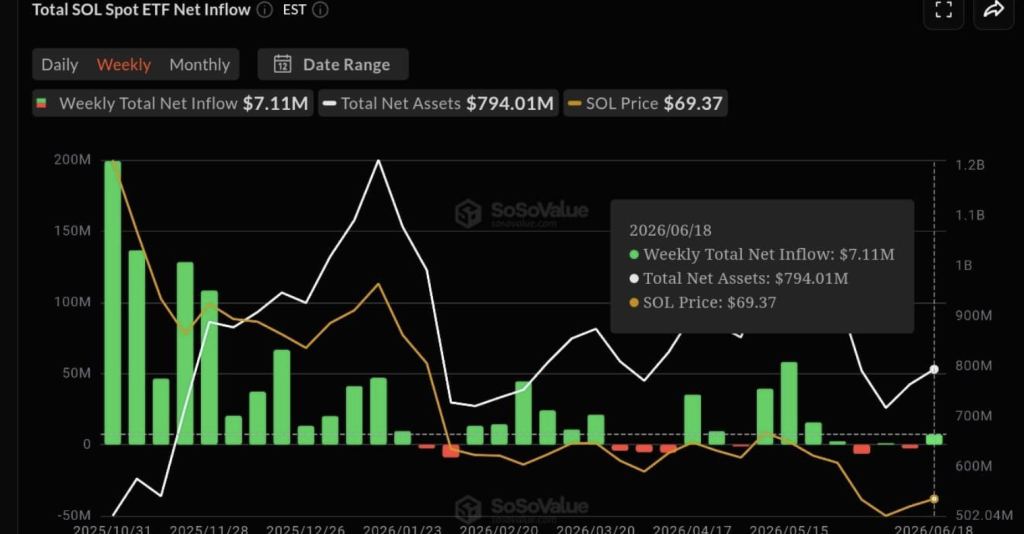
According to recent data, spot Solana ETFs attracted more than $7.1 million in net inflows during the past week. That’s a notable shift from the previous week’s outflows of approximately $2.5 million.
The turnaround coincided closely with SOL’s price recovery.
ETF flows are often watched as a proxy for investor sentiment because they provide insight into whether capital is entering or leaving an ecosystem. Positive flows don’t guarantee higher prices, but they do suggest investors remain interested in gaining exposure.
In Solana’s case, the return of inflows adds another layer of support to the recovery narrative.
Network Activity Keeps Climbing
Beyond investment demand, Solana’s blockchain activity continues to strengthen.
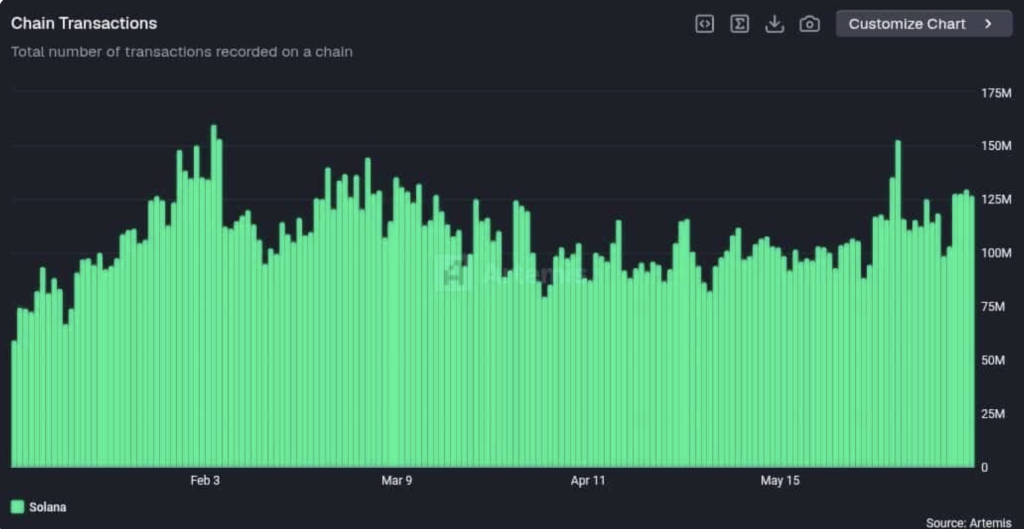
According to Artemis data, daily transactions on the network have roughly doubled since the beginning of the year. Activity has climbed from around 60 million daily transactions in January to nearly 120 million today.
That’s a significant jump.
Network usage is often viewed as one of the most important indicators of blockchain health because it reflects actual engagement rather than pure speculation. Rising transaction counts suggest users continue interacting with applications, DeFi platforms, and services built on the network.
In other words, Solana’s ecosystem remains busy even during periods when market sentiment fluctuates.
Can Strong Fundamentals Fuel a Breakout?
The combination of rising ETF inflows and accelerating network activity gives Solana a stronger foundation than many competing assets currently enjoy.
Those metrics suggest that interest in the ecosystem remains healthy despite short-term technical challenges.
If buyers can absorb selling pressure near $75, Solana may be able to build enough momentum for a larger breakout. A successful move above resistance could attract additional traders and potentially open the path toward higher price targets.
However, resistance is resistance for a reason.
Until that barrier is cleared, caution remains warranted.
What Comes Next for SOL?
For now, Solana finds itself at a critical crossroads.
A brief consolidation or pullback could help reset momentum and prepare the market for another attempt at breaking through resistance. As long as SOL remains above the recent higher low near $68, the bullish structure remains largely intact.
If that support level fails, though, downside risks increase considerably. A break below $68 could expose the token to a deeper correction toward the $60 region, where buyers may once again attempt to establish support.
The next move will likely depend on how traders react around current levels.
For now, Solana’s technical indicators are flashing mixed signals. Short-term caution is warranted, but strong ETF demand and growing blockchain activity continue providing reasons for optimism beneath the surface.