
- Solana is approaching three tightly stacked resistance levels near the $87 region.
- The Fibonacci 0.5 retracement at $87.56 has repeatedly rejected previous breakout attempts.
- Macro developments and geopolitical sentiment may ultimately decide whether SOL targets $98 or revisits support near $75.
Solana is once again approaching a major technical zone that traders have been watching closely for weeks now. At the time of writing, SOL is trading around $85.8, sitting just beneath a tightly packed cluster of resistance levels that could decide whether the next move becomes a breakout or another rejection.
What makes this setup interesting is how compressed the resistance structure has become. Three separate technical barriers are stacked within less than $1.70 of each other, creating what looks more like a single ceiling rather than multiple independent hurdles. That tight grouping often increases the importance of the area because once price breaks through, momentum can accelerate pretty quickly.
Recent price action already showed how difficult this region has been for bulls. Solana managed to break above both the 100-day and 50-day simple moving averages during earlier attempts and even reached the Fibonacci 0.5 retracement level at $87.56 three different times. Each attempt failed. Every single one eventually lost momentum and got pushed back lower again.
That repeated rejection matters more than the moving averages themselves honestly. The Fibonacci 0.5 zone has already proven it can absorb aggressive buying pressure, making it the level traders seem most focused on heading into the next attempt.
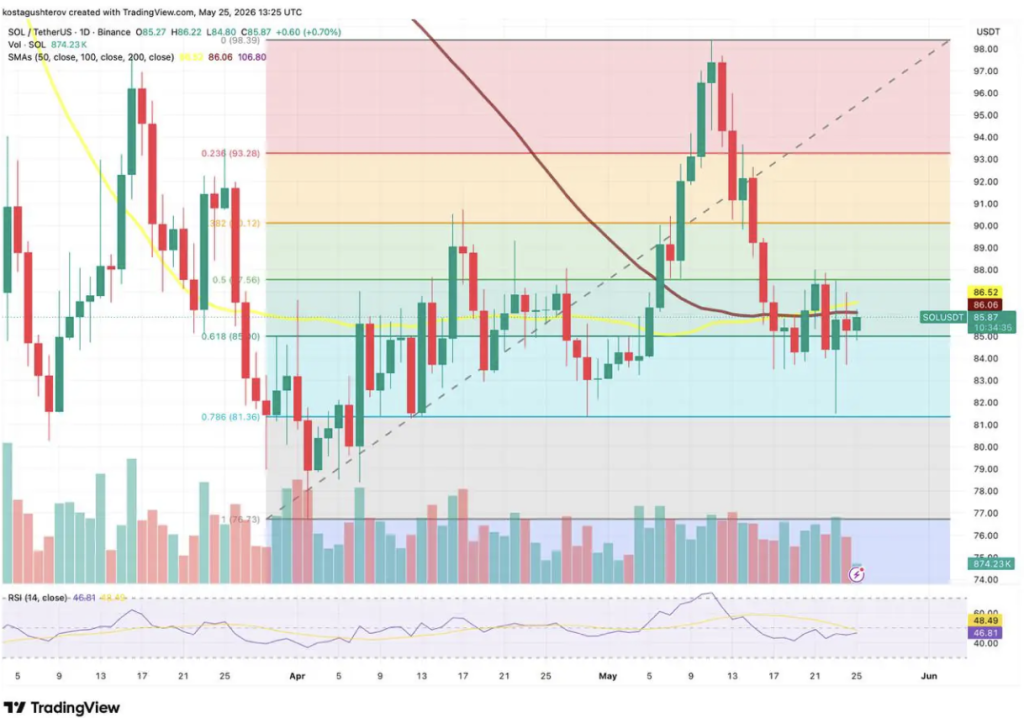
Solana Faces Three Resistance Levels Within Tight Range
Right now, SOL remains slightly below the first resistance layer. Price at roughly $85.87 sits just under the SMA100 at $86.06 and about $0.65 below the SMA50 at $86.52. Those two moving averages are separated by only around $0.46, forming a narrow resistance cluster directly above current price action.
If bulls manage to reclaim both moving averages cleanly, the next challenge immediately becomes the Fibonacci 0.5 retracement at $87.56. That leaves almost no breathing room between resistance levels, which explains why the market has struggled to generate sustained upside momentum lately.
The technical structure almost feels like a staircase with three locked gates sitting one after another. Even during previous rallies where Solana temporarily cleared the moving averages, the Fibonacci barrier ultimately stopped the breakout from continuing higher.
Because of that, traders now see the $87.56 level as the real battleground. Breaking above it on strong volume could shift short-term momentum considerably, while another rejection may reinforce the broader consolidation structure that has controlled SOL for weeks.
RSI Signals Market Still Lacks Strong Conviction
Momentum indicators currently lean slightly bearish, though not aggressively so. On the daily chart, the Relative Strength Index sits near 46.81 while remaining below its signal line around 48.49. That spread suggests downside pressure still holds a small advantage for now.
At the same time, RSI has spent much of this consolidation phase oscillating between the 45 and 50 range without fully collapsing into oversold territory or reclaiming strong bullish momentum above 50. In other words, the market still appears undecided.
A sustained RSI breakout above 50 would likely become the first meaningful sign that buyers are regaining control with real conviction behind the move. Without that confirmation, traders may continue treating each rally attempt cautiously, especially given how many times SOL has already failed near the Fibonacci resistance.
Low-conviction rebounds can sometimes become exhaustion rallies instead of genuine breakouts, and right now the chart still hasn’t fully answered which scenario Solana is building toward.
Macro Conditions May Decide Solana’s Next Big Move
Technically, the next upside targets remain fairly clear if Solana finally breaks above the $87.56 Fibonacci level on a daily closing basis. The next resistance sits near the 0.382 retracement at $90.12, followed by the 0.236 level around $93.28. Many traders are already watching the broader $91 to $92 area as the first meaningful bullish target above current structure.
On the downside, another rejection from the 0.5 Fibonacci zone could send SOL back toward immediate support near the 0.618 retracement around $85. A deeper breakdown may reopen the $83 consolidation zone where buyers previously stabilized price action during earlier pullbacks.
Still, the larger direction probably depends on something technical charts alone can’t predict — macro conditions. Ongoing Iran-US negotiations have created repeated swings in market sentiment over recent months, with optimism and uncertainty constantly replacing one another before any final agreement materializes.
That uncertainty has left risk markets trapped in hesitation. Solana’s Fibonacci levels, moving average cluster, and RSI structure are all reflecting the same broader reality: traders are waiting for an external catalyst strong enough to force a decisive move.
If geopolitical tensions ease and markets shift toward stronger risk appetite, Solana could quickly target the Fibonacci 0 level near $98.39, which represents the May high and roughly a 14.6% climb from current price. On the other hand, if negotiations deteriorate and broader risk sentiment weakens again, SOL may revisit the February support region near $75 alongside the deeper Fibonacci retracement zone around $76.73.
For now though, the market remains stuck between those possibilities, and the chart itself can’t determine which outcome arrives first.