
- XRP and Stellar remain under strong bearish pressure after recent weekly declines.
- CoinGlass data shows traders increasingly positioning for downside continuation across both assets.
- XRP support near $1.300 and XLM support near $0.136 remain key levels traders are watching closely.
Ripple’s XRP and Stellar’s XLM continue struggling under heavy selling pressure as bearish momentum remains firmly in control across both markets. After declining roughly 5% and 12% respectively over the previous week, the two altcoins are still trading beneath every major Exponential Moving Average, a technical setup that generally signals weakness rather than recovery. Momentum indicators also continue leaning negative, while derivatives data shows traders increasingly positioning for additional downside in the near term.
At the moment, the broader structure around both XRP and XLM looks defensive. Buyers have attempted short-term rebounds several times recently, but those moves continue fading before stronger momentum can develop. Until key resistance zones are reclaimed properly, the market still appears tilted toward caution rather than optimism.
Traders Increase Bearish Bets on XRP and XLM
One of the clearest signs of weakening sentiment comes from CoinGlass long-to-short ratio data. XRP currently holds a long-to-short ratio near 0.90, while XLM sits around 0.93. Both readings hover near their lowest levels seen this month, which suggests bearish positioning has continued building steadily underneath recent price action.
When those ratios remain below 1, it generally means more traders are actively betting on downside continuation rather than upside recovery. Importantly, this doesn’t necessarily guarantee immediate crashes, but it does reveal where market sentiment currently leans. Right now, traders appear far more comfortable shorting rallies than aggressively chasing breakouts.
That growing imbalance between bullish and bearish positioning often creates difficult trading environments for altcoins already struggling beneath major technical resistance levels.
XRP Faces Growing Risk of a Deeper Correction
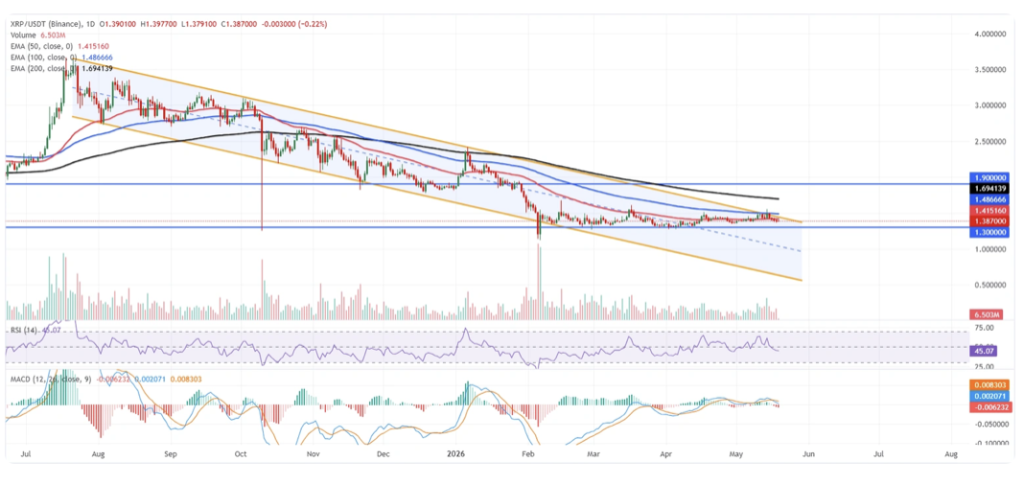
XRP is currently trading near $1.387 and still maintains a fairly bearish short-term structure overall. The token continues trading beneath all major EMAs, with the 50-day EMA around $1.415 acting as the first major resistance overhead. Above that, the upper boundary of XRP’s descending parallel channel near $1.442 continues reinforcing broader selling pressure.
The 100-day EMA near $1.486 and the 200-day EMA around $1.694 create even larger resistance barriers higher up the chart. Momentum indicators aren’t helping much either. XRP’s Relative Strength Index sits near 45, still below the neutral midpoint, while the MACD histogram remains negative, both signaling that sellers continue controlling momentum for now.
On the downside, traders are closely watching the horizontal support region around $1.300. That level could become the next major area where buyers attempt to stabilize price if bearish pressure intensifies again. However, unless XRP can reclaim the 50-day EMA and eventually close above the descending channel resistance, the broader technical structure likely remains tilted bearish.
A stronger breakout above $1.442 would begin easing some of the current downside pressure, though several larger resistance zones still sit overhead even under a bullish recovery scenario.
Stellar Weakens Further Beneath Major Resistance Levels
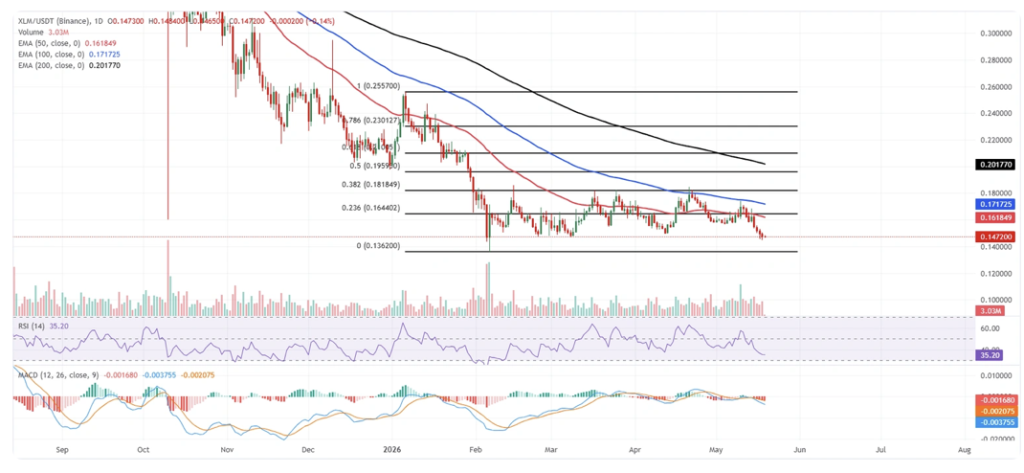
Stellar’s technical structure currently looks even weaker than XRP’s. XLM trades near $0.147 after continuing its decline beneath every major EMA on the daily chart. The 50-day EMA around $0.161 now acts as immediate resistance alongside the 23.6% Fibonacci retracement level near $0.164. Slightly higher, the 100-day EMA at $0.171 creates another difficult ceiling for bulls attempting recovery.
Momentum indicators continue flashing weakness as well. Stellar’s RSI currently sits near 35, hovering only slightly above oversold territory, while the MACD indicator remains firmly negative. Together, those signals suggest downside pressure still dominates the market rather than pointing toward a confirmed bottom formation.
If XLM attempts a rebound, bulls would first need to reclaim resistance near $0.161 and $0.164 before stronger recovery discussions even begin. Beyond that, the 38.2% Fibonacci retracement near $0.181 and the 50% retracement around $0.195 create additional resistance barriers. The 200-day EMA at roughly $0.201 also reinforces broader bearish control across the larger trend structure.
On the downside, Stellar’s nearest major support level sits near the February low around $0.136. If bearish momentum continues strengthening, traders will likely watch that zone closely to see whether buyers finally step back into the market with stronger conviction.
For now though, both XRP and XLM remain trapped inside fragile technical structures while bearish traders continue dominating momentum across short-term market conditions.