- Cardano remains under pressure near the critical $0.20 support level as broader market weakness continues.
- RSI and moving average structures both suggest bearish momentum still dominates ADA price action.
- Analysts warn a breakdown below $0.20 could expose Cardano to deeper downside toward the $0.14 region.
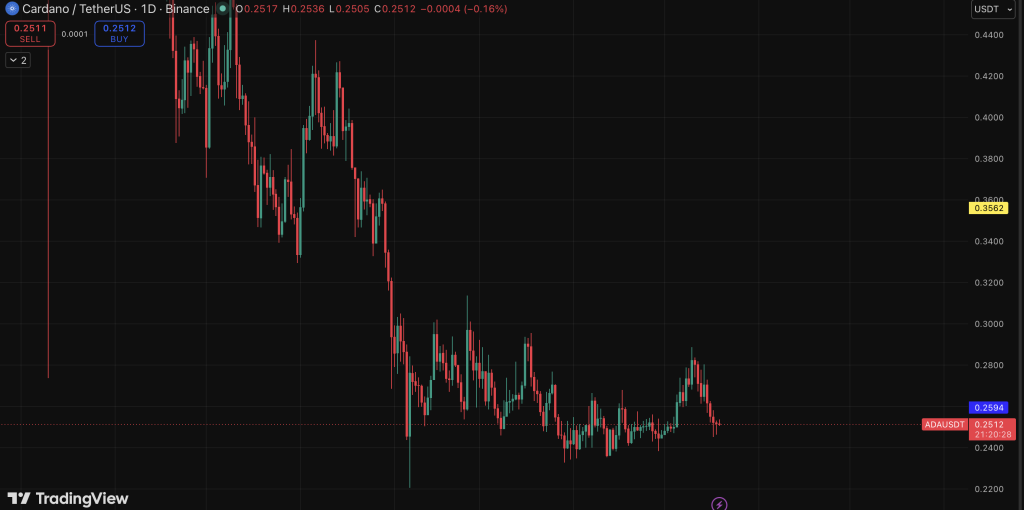
Cardano is trading near the $0.248 region after slipping roughly 2.5% over the last 24 hours, and honestly, the chart structure is starting to look increasingly uncomfortable for bulls. The market has now shifted attention squarely toward the $0.20 support level, which many traders see as the most important short-term line in the sand. If that level breaks cleanly, the downside could open up very quickly.
The broader crypto market hasn’t helped either. Bitcoin recently dropped toward $76,700, wiping more than $100 billion from the total crypto market capitalization and dragging sentiment lower across altcoins. In that environment, weaker charts like ADA tend to face even heavier pressure as traders rotate into defensive positioning instead of chasing rebounds.
At the moment, Cardano’s price action still looks stuck inside a broader corrective trend rather than showing signs of meaningful recovery.
Momentum Indicators Continue Flashing Weakness
One of the clearest warning signs comes from the Relative Strength Index on the daily chart. ADA’s RSI remains below the important neutral 50 level, signaling that selling pressure still outweighs buying demand across the market. More importantly, the indicator hasn’t shown any strong bullish divergence yet, meaning the weakness appears persistent instead of being a simple short-term flush lower.
That distinction matters because oversold markets can stay oversold longer than traders expect.
The moving average structure also continues leaning heavily bearish. Cardano remains trapped beneath both the 50-day and 200-day exponential moving averages, creating what traders commonly refer to as a “death cross” setup. In practical terms, the short-term trend has fallen below the longer-term trend while price trades beneath both averages simultaneously. That combination usually acts more like overhead resistance than reliable support.
Every attempted bounce recently has been sold into fairly aggressively before momentum could build. That’s generally not the behavior markets show during strong recovery phases.
ADA’s Broader Downtrend Has Been Building for Months
The larger technical structure around Cardano didn’t suddenly weaken overnight either. ADA has consistently printed lower highs ever since failing to reclaim the major $0.68 to $0.70 resistance region back in late 2025. Multiple breakout attempts throughout early 2026 near the mid-$0.50 range also failed, reinforcing the broader medium-term downtrend already forming underneath the surface.
Analyst Ali Martinez recently described Cardano’s setup as a descending triangle pattern, which traders often interpret as a bearish continuation structure. According to that analysis, a confirmed downside breakdown could potentially trigger another 33% decline from the current range. If that scenario plays out fully, ADA could eventually slide toward the $0.14 to $0.17 area.
That’s obviously not guaranteed, but it does show how much pressure still exists underneath the current structure.
Whale Accumulation Adds a Complicated Twist
Interestingly, on-chain data presents a slightly more nuanced picture. Large holders currently control roughly 67% of the circulating ADA supply, marking the highest whale concentration since 2020. On paper, that could suggest some long-term investors still see value accumulating at these lower prices.
But whale concentration can cut both ways.
While accumulation sometimes appears near long-term bottoms, it doesn’t automatically mean a reversal happens immediately. Markets can remain trapped in bearish phases for extended periods even while larger players quietly build positions in the background. Traders hoping whale activity alone will instantly reverse the trend may end up disappointed if broader market conditions remain weak.
For now, Cardano’s technical structure still looks fragile unless buyers can strongly defend the $0.20 region.
Three Key Scenarios Traders Are Watching
The bullish scenario remains relatively straightforward. If ADA successfully holds above $0.20 on daily closes while reclaiming resistance near $0.26 with stronger volume, traders could finally begin talking about genuine trend stabilization rather than temporary oversold rebounds. That would likely become the first meaningful signal that buyers are regaining some control.
The more neutral outcome involves Cardano continuing to drift sideways between roughly $0.21 and $0.25 while momentum stays muted. Under that setup, the market would probably wait for a larger macro catalyst or Bitcoin-led recovery before choosing a stronger direction.
Then comes the bearish case. If ADA closes decisively beneath $0.20, analysts believe the door could open quickly toward the broader $0.14 to $0.18 support region. And if that area eventually fails too, the next meaningful historical support cluster reportedly sits near $0.11 to $0.13.
For now, the pressure continues building. The only real question is whether buyers still have enough strength left to defend the current floor before another leg lower begins.