
- ETH remains range-bound near $2,300 with no confirmed breakout
- Resistance at $2,400–$2,430 continues to cap upward momentum
- ETF flows and derivatives activity suggest potential for sharp moves
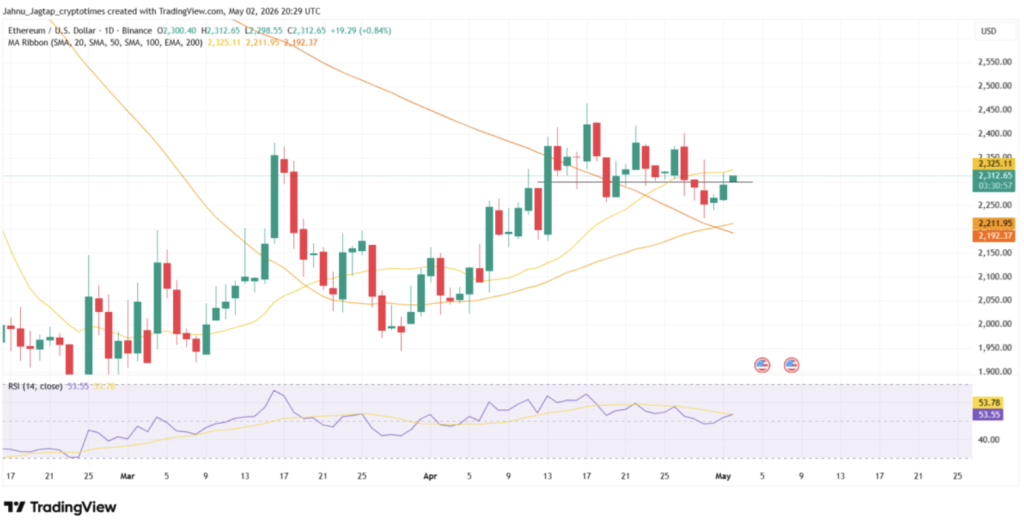
Ethereum has been… kind of drifting this week, if you look at it closely. As of May 2, ETH is hovering near $2,300, barely moving on the weekly timeframe, down just a fraction overall. It’s not breaking down, but it’s also not pushing higher in any convincing way. This sort of sideways movement usually signals consolidation, especially when price keeps circling around a psychological level like $2,300.
Bulls Defend Support but Face Resistance
On the daily chart, there are signs that buyers are still trying to hold the line. ETH bounced slightly and managed to stay above the $2,300–$2,310 zone, which is now acting as a short-term support area. That’s important, but not enough on its own to shift momentum.
The problem is overhead resistance. ETH keeps running into pressure around $2,400 to $2,430, and so far, it hasn’t been able to push through. Until there’s a clean break above that range, the recovery remains… questionable, or at least incomplete.
If things turn lower, support sits around $2,280, and below that, a cluster of moving averages near $2,200 starts to matter. Losing those levels would probably drag price back toward $2,100, which would change the tone fairly quickly.
Indicators Show Neutral Momentum
Momentum indicators aren’t giving strong signals either way. RSI is sitting near 53, which is slightly bullish, but not by much. It basically says the market is balanced, buyers are present, but not aggressive enough to drive a breakout.
This fits with the overall structure. ETH isn’t overheated, but it also lacks the volume push needed to confirm a trend reversal. It’s more of a wait-and-see setup right now.
Ichimoku Signals Early Improvement
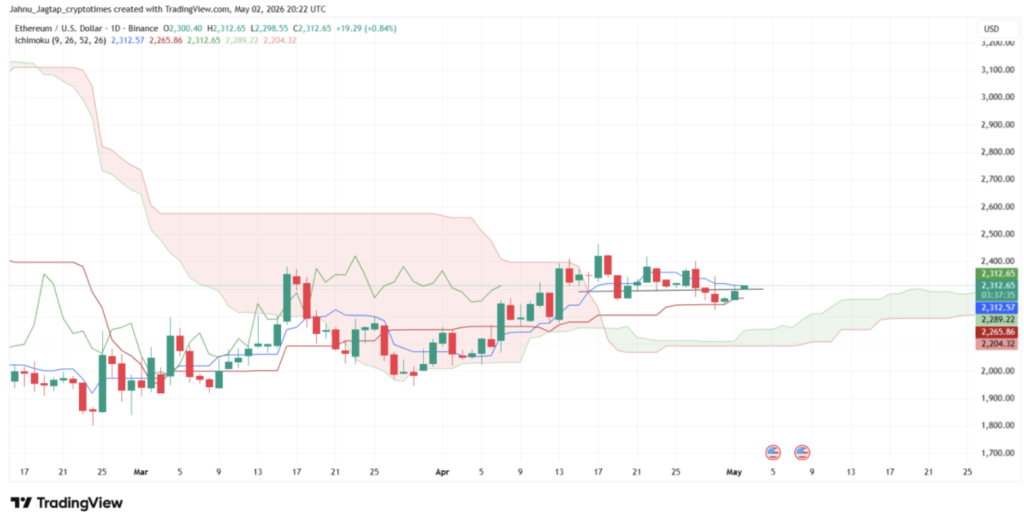
Looking at the Ichimoku chart, there are small signs of improvement, though they’re still early. ETH is trading right around the conversion line, which acts as a short-term test of momentum. Holding above it could support a gradual shift upward, but it’s not a strong signal yet.
The base line below is acting as support, and the cloud gives a wider cushion down toward the $2,200 range. Interestingly, the future cloud is starting to turn green, suggesting that bearish pressure from earlier months is fading, at least slightly. Still, for a real bullish confirmation, ETH needs to close above the $2,380–$2,430 zone.
ETF Flows and Derivatives Add Complexity
The ETF story has been a bit mixed. Late April saw consistent outflows, adding up to over $180 million, before flipping back to inflows on May 1. That helped sentiment a bit, but not enough to fully reverse the weekly trend, which still leans negative.
At the same time, derivatives activity remains heavy. Futures volume is significantly higher than spot, and open interest is elevated, which can increase volatility if price breaks out of its current range. It’s the kind of setup where moves, once they start, can get sharp quickly.
On-Chain Activity Slows Despite Development Progress
On-chain data isn’t entirely strong either. Stablecoin supply on Ethereum dipped slightly, and DEX trading volume has dropped quite a bit over the past week. That suggests less activity, even though Ethereum still dominates overall network usage.
On the development side, though, progress continues. The upcoming Glamsterdam upgrade is moving forward, with key milestones already achieved. It’s a strong long-term catalyst, but for now, price hasn’t really reacted to it.
Market Waits for a Clear Direction
So where does that leave ETH? Somewhere in between. It’s not weak enough to call a breakdown, but not strong enough to confirm a breakout either. ETF flows are stabilizing, development is progressing, but price is still stuck around $2,300.
Until volume steps in and pushes ETH out of this range, the market will likely stay cautious. And when it finally moves, it probably won’t be subtle.