
- Ethereum holds long-term support near $2,300 after recent correction
- Key resistance at $2,480 and $3,500–$4,900 must break for bullish confirmation
- Chart patterns suggest a possible base forming before the next rally cycle
Ethereum is sitting in a pretty important zone right now, and depending on how you look at it, things could go either way. Price is hovering around long-term support after a decent correction, and while some charts hint at recovery, it’s not exactly a confirmed breakout yet. ETH is still under pressure to reclaim higher levels before any real bullish narrative takes hold, and until that happens, the market stays… cautious.
Long-Term Structure Points Higher, Eventually
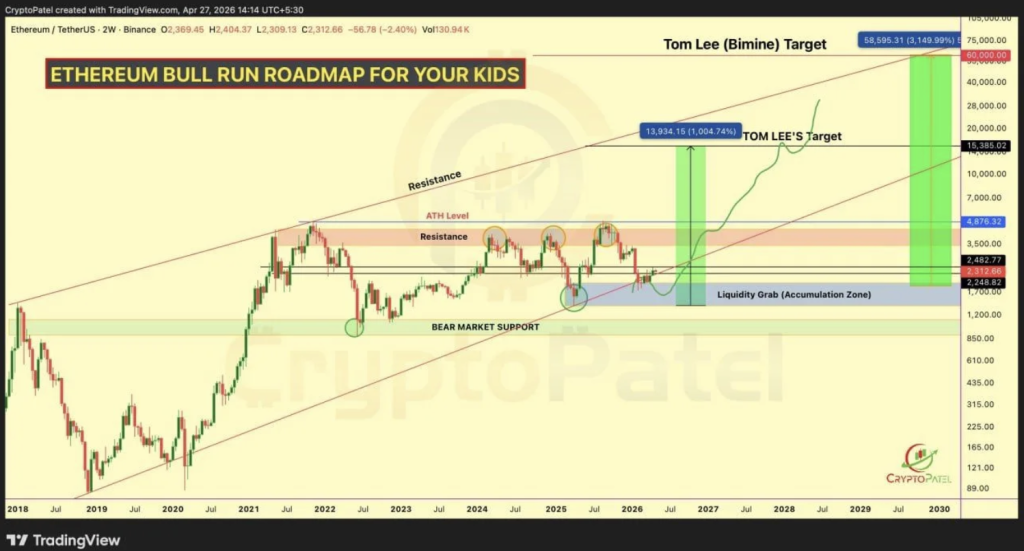
On the bigger picture, there’s a chart making the rounds that maps Ethereum inside a long-term upward channel stretching years into the future. Right now, ETH is trading near $2,300, sitting toward the lower end of that structure after getting rejected from the $3,500–$4,800 zone earlier.
That lower range, roughly between $1,700 and $2,250, is being labeled as an accumulation area, or even a liquidity grab zone. It’s not the first time ETH has been here either. Since 2022, price has bounced from similar levels more than once, which gives the area some weight, even if it doesn’t guarantee anything.
Resistance Levels Still Stand in the Way
The challenge, though, is overhead resistance. First comes the $2,480 level, which ETH hasn’t convincingly reclaimed yet. Above that, there’s the much larger $3,500–$4,900 range, which includes the previous all-time high region.
That upper band has rejected price multiple times already, so breaking through it won’t be easy. But if ETH does manage it, and holds above, it could shift the entire structure. Until then, it’s just potential, not confirmation.
Interestingly, some long-term projections tied to this structure are… ambitious, to say the least. Targets like $15,000 or even $60,000 get mentioned, but those are far down the line and depend on a lot of things going right. For now, the focus is much simpler, hold support, reclaim mid-range, and then see what happens next.
Signs of a Base Forming on Shorter Timeframes
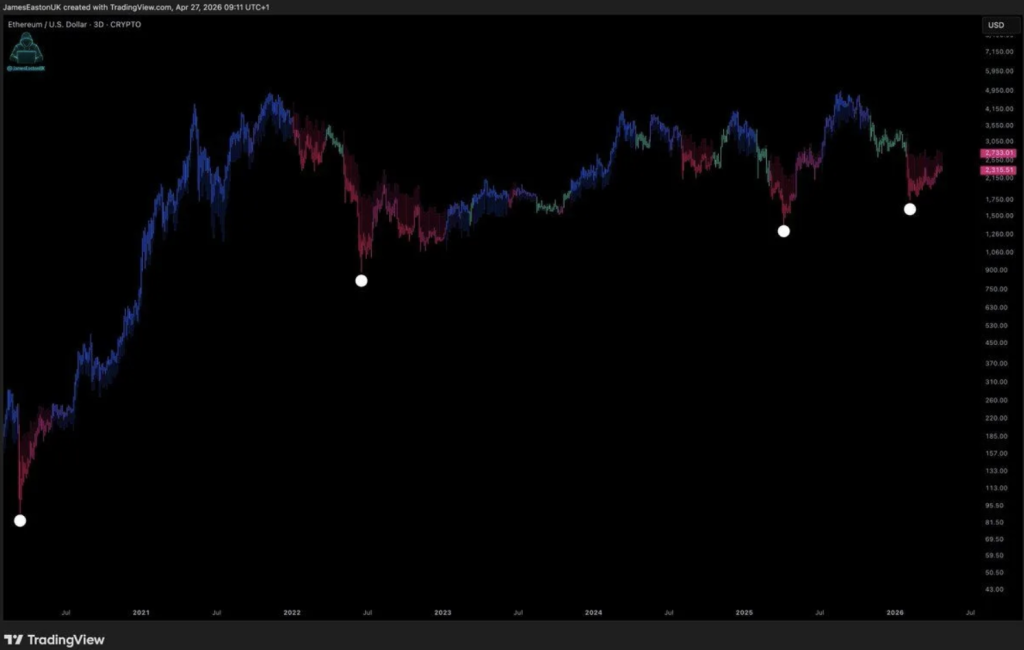
On the 3-day chart, there’s another pattern that’s starting to show up. Historically, Ethereum has gone through cycles, sharp drops, followed by long periods of stabilization, then eventually strong rallies. That pattern has repeated a few times already.
Right now, ETH seems to be in that middle phase again. After the latest decline, price is trying to stabilize, forming what could be another base. It’s not obvious yet, but the structure is starting to look familiar.
Previous rallies came after similar setups, once price stopped falling and began forming higher lows. But again, that confirmation isn’t here yet. ETH still needs to prove it can hold and climb.
A Market Waiting for the Next Phase
So where does that leave things? Somewhere in between recovery and uncertainty. Ethereum is holding a key support zone, and that matters, but it hasn’t flipped the structure bullish just yet.
If price starts reclaiming resistance levels, especially above $2,480 and eventually higher, then the next rally phase could start to take shape. If not, the market might stay in this slow, grinding phase a bit longer.
It’s one of those moments where the groundwork is being laid, quietly. And if history repeats, or even just rhymes a little, this could be the kind of setup that leads into a bigger move later on.