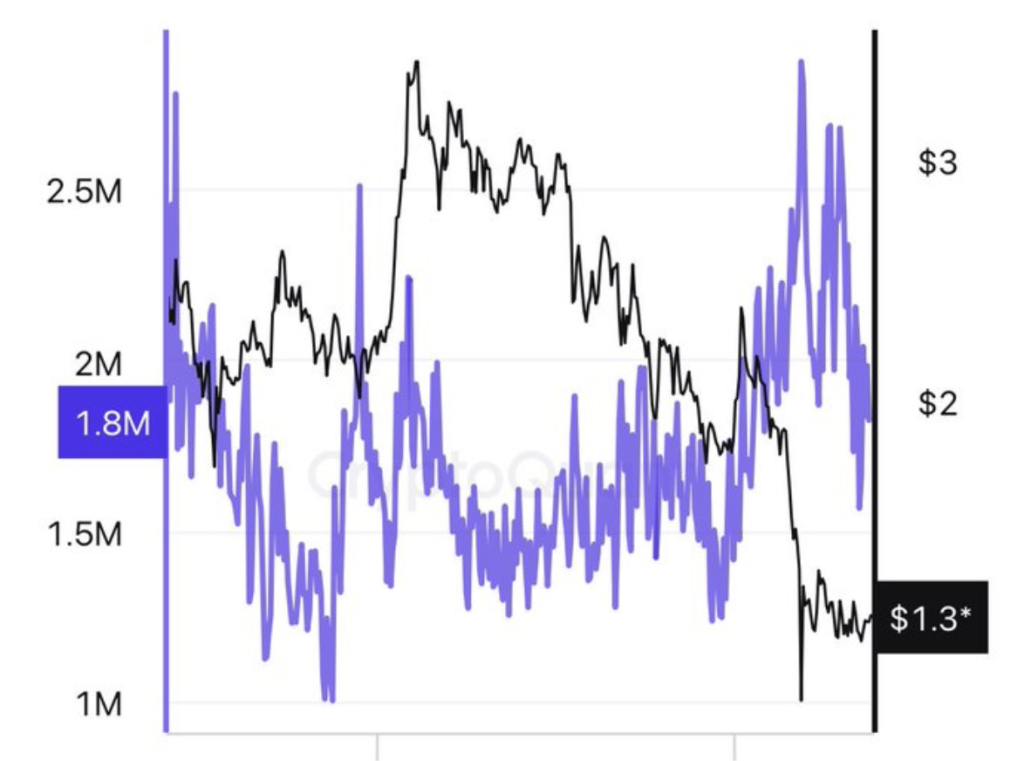
- XRPL daily transactions surged from about 1M to nearly 3M
- XRP Bollinger Bands show extreme volatility compression on the 2-day chart
- Whale accumulation is concentrated between roughly $1.21 and $1.51
Ripple’s XRP is back on traders’ radar again as of March 14, 2026, and this time the signals look… stronger than usual. Network activity has picked up sharply, volatility has tightened across the charts, and whale activity appears to be clustering around key price levels.
Interestingly, most of the broader market hasn’t been paying much attention. Many traders are still chasing louder narratives — memecoins, AI tokens, the usual noise. But historically, some of the strongest crypto setups tend to form quietly, before the crowd really notices.
So what exactly is happening with XRP right now?
XRPL Transactions Jump to Nearly 3 Million Per Day
One of the clearest signals comes from activity on the XRP Ledger itself.
According to data from CryptoQuant, daily transactions on XRPL have surged to roughly 3 million this week. That’s a massive jump compared with mid-2025 levels, when the network was processing closer to 1 million transactions per day.
In other words, network usage has nearly tripled.
That kind of increase usually suggests that real participation is returning to the ecosystem — whether from payments activity, traders moving funds, or broader ecosystem usage. It doesn’t automatically mean the price will surge tomorrow, of course.
But it does hint that something is building beneath the surface.

Volatility Compression Signals Possible Breakout
Meanwhile, technical indicators are flashing another interesting signal.
On the two-day chart, XRP’s Bollinger Bands have become extremely tight. Traders often watch for this pattern because volatility squeezes like this rarely last very long.
Eventually the market tends to break out — either upward or downward.
Looking back, similar squeezes in XRP have preceded some dramatic moves. Previous compression phases led to rallies of roughly 600% in one cycle and about 83% in another.
That doesn’t guarantee history will repeat, but it explains why many analysts are paying attention to the setup now.
When volatility compresses like this, it often means the market is essentially… holding its breath.

Whale Activity Clusters Around Key Price Levels
On-chain data also shows increasing activity from larger holders.
CryptoQuant reports that whales have become noticeably more active in both spot and futures markets around XRP’s current price zone. In spot markets, large wallet activity has been concentrated between roughly $1.21 and $1.51.
Futures data shows a similar pattern. Bigger players appear to be entering positions around the $1.30 to $1.50 range.
That overlap is important. When both spot and derivatives markets show accumulation in the same price band, it can signal stronger conviction among institutional or large investors.
Instead of panic selling, the behavior looks more like strategic positioning.
A Quiet Setup That Traders May Be Missing
Taken together, the signals form an interesting picture.
Network usage is expanding. Volatility is compressing. And large investors appear to be building positions in the same general price zone.
Meanwhile, the broader market is still distracted by faster-moving narratives elsewhere.
Sometimes the strongest setups in crypto develop exactly like this — quietly, without much attention, right before momentum suddenly returns.
Whether XRP actually breaks upward from this compression remains to be seen. But if whales continue accumulating while network activity rises, it becomes harder for traders to ignore the pattern.
For now, XRP seems to be sitting at a moment of pressure.
And markets under pressure… tend to move eventually.