- XRP has fallen more than 60% from its 2025 peak but is now stabilizing near $1.40
- An analyst says a key indicator historically linked to bullish moves has triggered
- Resistance between $1.45 and $1.50 may determine XRP’s next major price move
Something slightly unusual appears to be unfolding around XRP, at least according to one market analyst who has been tracking the asset closely. The token has fallen more than 60% from its 2025 peak, and sentiment across social media and trading forums has gradually turned bearish. Yet despite the negativity, a technical signal is flashing something quite different.
Arthur, the chief investment officer at RoyalPeakCap, recently said that one of his personal indicators has crossed a level that historically signals strong bullish momentum. The strange part? The price hasn’t reacted the way it usually does.
“RED ALERT: Something unusual is happening on XRP,” he wrote. “My personal indicator just crossed above the black line. Historically, every time this happens, an explosive bullish move follows. But this time… price is still ranging.”
Sideways Price Action Raises Concerns
Instead of rallying, XRP has been stuck moving sideways. And according to Arthur, that might actually be the worst possible outcome for the signal.
If the price continues to drift sideways while the indicator gradually cools back toward neutral territory, the bullish momentum that normally follows could simply fade away. In that case, the market might reset — and potentially open the door for another sharp decline.
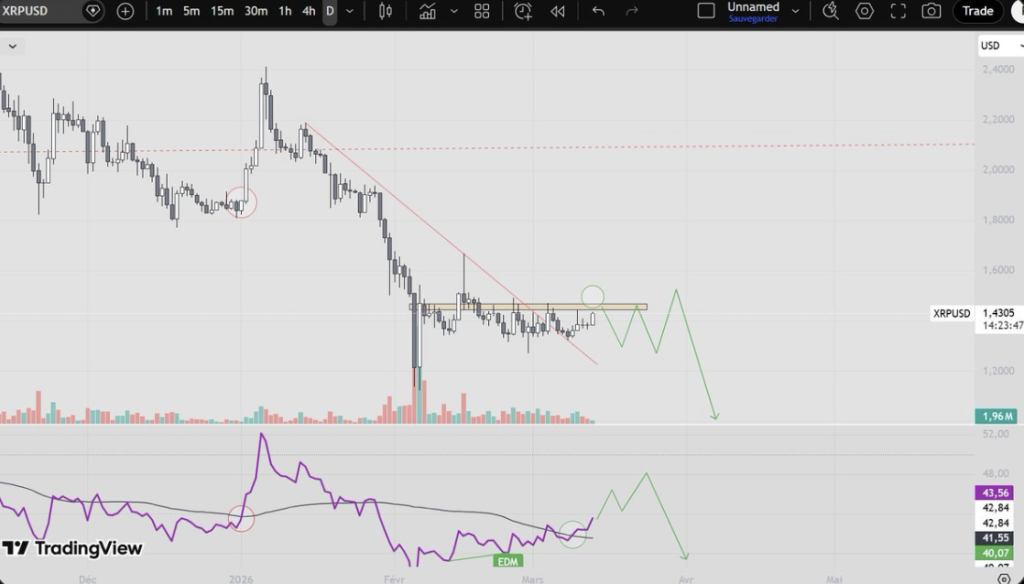
For now, XRP’s price has been hovering around the $1.40 level after several weeks of steady downward pressure. Each small rally has been quickly pushed back by sellers, suggesting that the market still lacks strong conviction.
Still, the fact that the price has stabilized near this level hints that the selling wave might be slowing down… at least temporarily.
RSI Shows Quiet Signs of Accumulation
One technical signal traders are watching is the Relative Strength Index. Interestingly, the RSI has been slowly climbing even though XRP’s price has mostly stayed flat.
That kind of divergence can sometimes hint at something happening beneath the surface. When momentum indicators rise while price stalls, it occasionally suggests that selling pressure is easing — or that larger investors may be accumulating quietly.
XRP also recently tested its descending trendline and briefly broke above it. The move didn’t spark a full rally, but it did suggest that the downtrend’s grip may be weakening slightly.
The key level to watch now sits between $1.45 and $1.50.
Resistance Zone Becomes a Critical Test
XRP has approached this resistance zone several times recently. Repeated tests of a level like that can produce very different outcomes depending on how the market reacts.
Sometimes the pressure builds until buyers finally break through. Other times, however, large traders use those small rallies as opportunities to sell into strength.
Arthur believes the second scenario may be more likely right now. If that’s correct, the market could be preparing for another round of weakness once buyers run out of momentum.
XRP Market Sits at a Decision Point
If XRP fails to break above resistance, the current sideways movement could simply be a pause before another downward leg. Traders often refer to this type of setup as a “liquidity trap.”
In simple terms, the market appears calm enough to draw in new buyers… but beneath the surface, conditions may still favor a drop.
For the moment, XRP is sitting at a critical crossroads. At the time of writing, CoinMarketCap data shows the token trading around $1.44 after gaining roughly 5% over the past 24 hours.
Whether that move turns into a sustained recovery — or just another temporary bounce — remains the question traders are watching closely.