
- BNB is approaching key support near $585 after failing to break resistance at $660.
- The token remains below major moving averages, signaling continued downward pressure.
- Momentum indicators suggest consolidation rather than a strong bullish breakout.
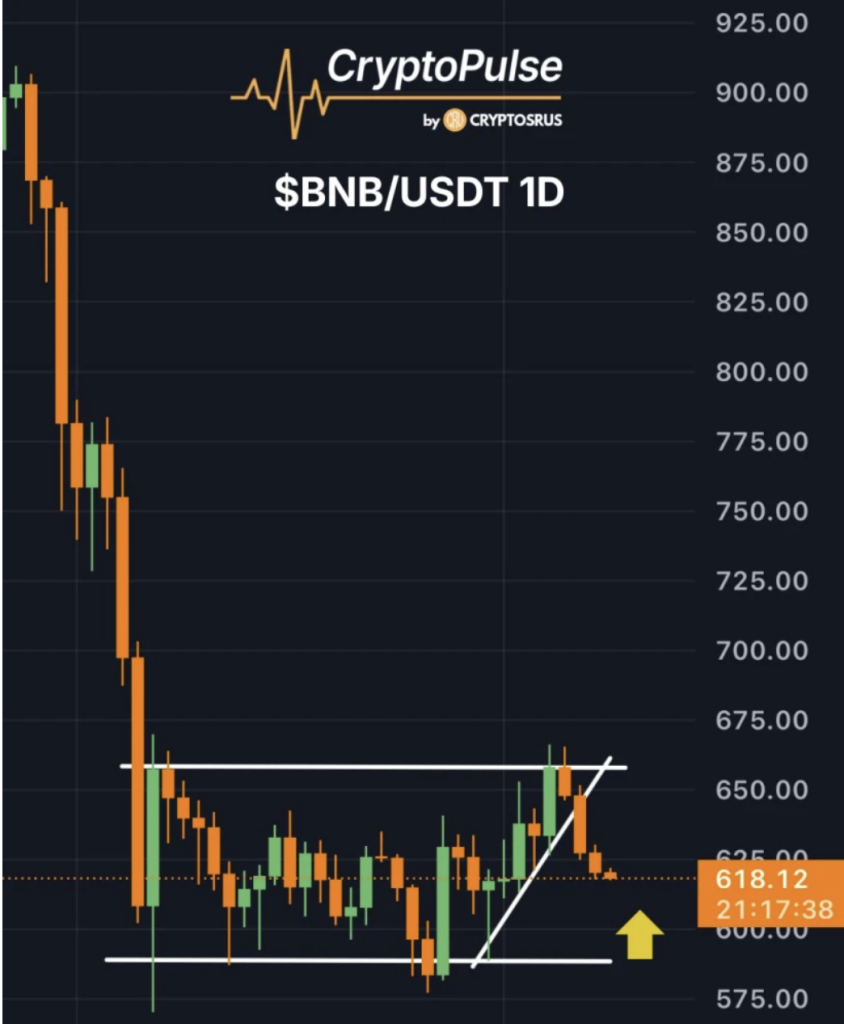
Binance Coin has started drifting back toward an important support zone after running into heavy resistance higher up. The price recently tried to break past the $660 level but couldn’t quite hold the move, and the rejection pushed BNB lower again. Now the token is hovering closer to the $585 region — an area where buyers have stepped in before.
According to analysis shared by Crypto Pulse on March 8, the latest pullback comes after BNB failed to break the upper boundary of its recent trading range. When breakouts stall like that, the market often snaps back toward support to test whether demand still exists there. That’s exactly what appears to be happening now.
If the $585 level holds, the structure could remain intact and buyers might attempt another push toward the $660 range high. But if that support gives way… things could get messy rather quickly.
Market Structure Shows Growing Downward Pressure
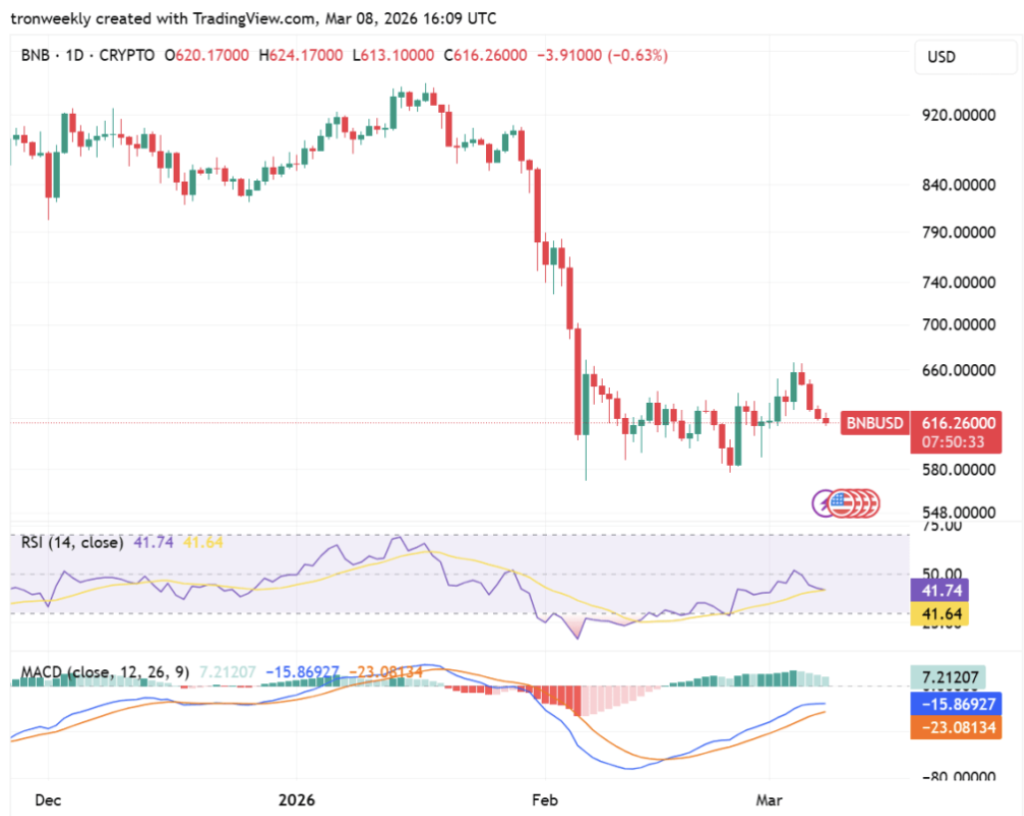
Looking at the broader chart, the trend hasn’t been particularly encouraging for bulls lately. Data from TradingView shows that BNB has been under consistent pressure since its sharp drop from the $900 area earlier in February.
Right now the token is trading near $616 and struggling to break above the 20-day exponential moving average, which sits around $633. That level has become a short-term ceiling for price action. Each time BNB approaches it, the rally seems to stall.
Technically speaking, that kind of behavior usually signals hesitation in the market. Buyers are trying to regain control, but the momentum just isn’t strong enough yet.
Adding to the cautious tone, BNB’s price is currently sitting between the middle and lower Bollinger Bands. That placement typically suggests weaker price pressure and a lack of strong bullish momentum.
Long-Term Indicators Still Lean Bearish
Zooming further out makes the challenge clearer. The 200-day exponential moving average sits far above the current price — around $807 — which shows how much ground BNB has lost during the recent decline.
When price remains well below long-term moving averages like that, the broader trend often stays heavy. In other words, even if short-term rallies occur, they tend to run into resistance before developing into a full trend reversal.
Until BNB can reclaim resistance levels closer to $653 or above, the market may continue moving sideways within its current range.
Momentum Signals Suggest Consolidation, Not a Breakout
Momentum indicators tell a fairly similar story. The Relative Strength Index currently sits around 41.7, placing it below the neutral 50 level. That reading doesn’t indicate oversold conditions, but it does show that bullish momentum has cooled significantly.
Rather than trending upward or downward sharply, the RSI has been drifting sideways. That often signals a consolidation phase where the market is deciding its next direction.
The MACD indicator, interestingly enough, has produced a small bullish crossover. The blue MACD line recently moved above the orange signal line, and the histogram bars have turned green.
Still, there’s a catch.
Both lines remain deep below the zero level — roughly at -15.86 and -23.08 — which suggests that the bullish signal is fairly weak. Instead of marking the start of a strong rally, the crossover may simply represent a short-term correction within a larger bearish structure.
For now, BNB appears caught in a wait-and-see zone.