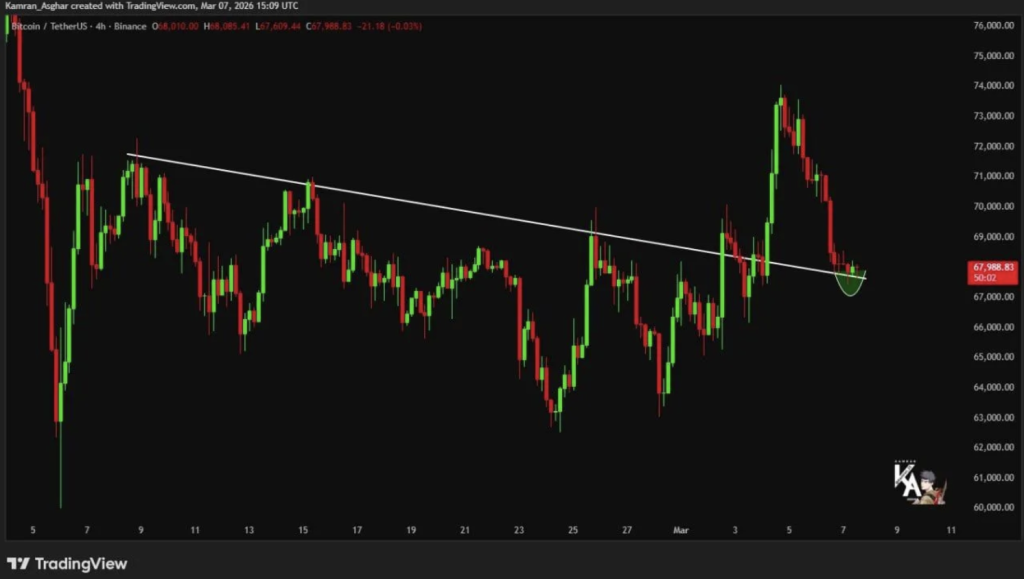
- Bitcoin is retesting a previously broken trendline near the $67K–$68K level.
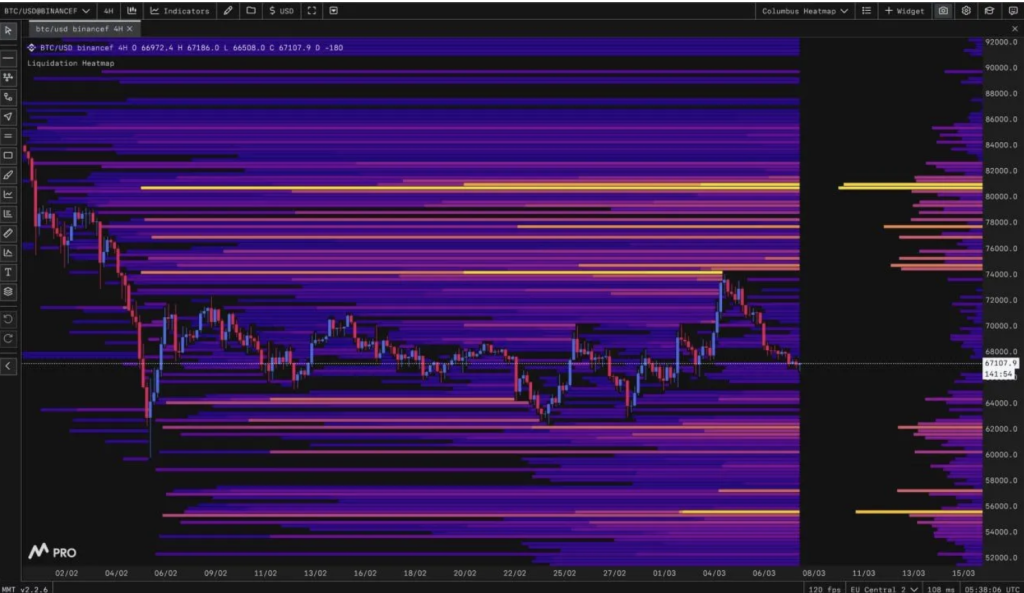
- A liquidity heatmap shows strong order clusters near the $64K–$65K region.
- The market remains range-bound unless buyers reclaim the upper channel resistance.
Bitcoin is currently sitting at a pretty important technical moment. The price has drifted back toward a previously broken trendline, and traders are watching closely to see whether the breakout still holds… or if the market slips back into its old range again.
On the four-hour BTC/USDT chart, analyst Kamran Asghar pointed out that Bitcoin is essentially retesting the breakout zone it cleared earlier. That trendline had been acting as resistance throughout much of February, blocking several rally attempts along the way. Eventually though, buyers pushed through it during a sharp move that sent Bitcoin climbing toward the $73,000–$74,000 area.
But markets rarely move in a straight line. After reaching that peak, the rally cooled off and Bitcoin began drifting lower again.
Trendline Support Now Faces Its First Real Test
The recent pullback has now brought price back toward the same descending trendline — except this time, Bitcoin is approaching it from above. At the moment, BTC is hovering around the $67,000 to $68,000 range while testing that level.
This kind of retest is actually pretty common after a breakout. When resistance gets broken, traders usually want to see whether that level can flip into support. If buyers step in and defend it, the breakout tends to remain valid and the broader uptrend can continue.
Interestingly, the chart also shows a small rounding formation developing near the retest zone. It’s not a dramatic pattern, but it does hint that the market might be trying to stabilize after the recent decline rather than immediately continuing downward.
That makes the current area unusually important for short-term direction.
Liquidity Map Suggests Pull Toward Lower Levels
At the same time though, a separate liquidity heatmap is telling a slightly different story. According to analysis shared by trader Columbus, Bitcoin may still be attracted to lower price levels where a cluster of liquidity sits waiting.
The MMT heatmap shows dense pockets of orders sitting below the current trading range, particularly around the mid-$64,000 to $65,000 region. In many cases, price tends to gravitate toward these zones when momentum fades and the market struggles to push higher.
Earlier attempts to break above the channel resistance failed, which reinforced this possibility. Once Bitcoin was rejected near the top of the range, the price gradually drifted lower rather than launching into a new trend.
And that behavior matters.
Bitcoin Stuck Between Breakout Support and Range Rotation
Right now the market appears stuck between two competing forces. On one side, the trendline retest could act as support and allow the earlier breakout structure to remain intact. If buyers defend this level, Bitcoin may attempt another push toward the $73,000 area or even higher.
On the other hand, the broader range structure still hasn’t been fully broken. The liquidity heatmap suggests that unless buyers reclaim the upper boundary of the channel, Bitcoin could continue rotating inside the range for a while longer.
If the trendline fails to hold, the chart would imply that the breakout attempt has weakened. In that scenario, the market could start searching for support closer to the $64,000–$65,000 zone, where liquidity appears much heavier.
For now, Bitcoin is balancing right in the middle of those possibilities. Not quite bullish, not quite bearish either — just… waiting for the next move.