
- XLM posted a short-term rebound, but remains in a broader bearish weekly structure
- Major resistance levels at $0.22 and $0.26 will decide whether recovery can extend
- Momentum indicators show easing selling pressure, though no trend reversal is confirmed yet
Stellar’s native token XLM posted fresh gains on Monday as buyers pushed prices higher across major exchanges. Data from CoinMarketCap shows the token climbed roughly 4.7% over the past 24 hours, extending a modest recovery that has been building over the past week. At the time of writing, XLM was trading near $0.18, with 24-hour trading volume hovering around $241 million.
Market capitalization also moved higher during the session, rising about 4.6%. Still, analysts remain cautious, noting that while short-term momentum has improved, the broader weekly trend remains firmly under bearish control. In other words, this looks more like relief than reversal, at least for now.
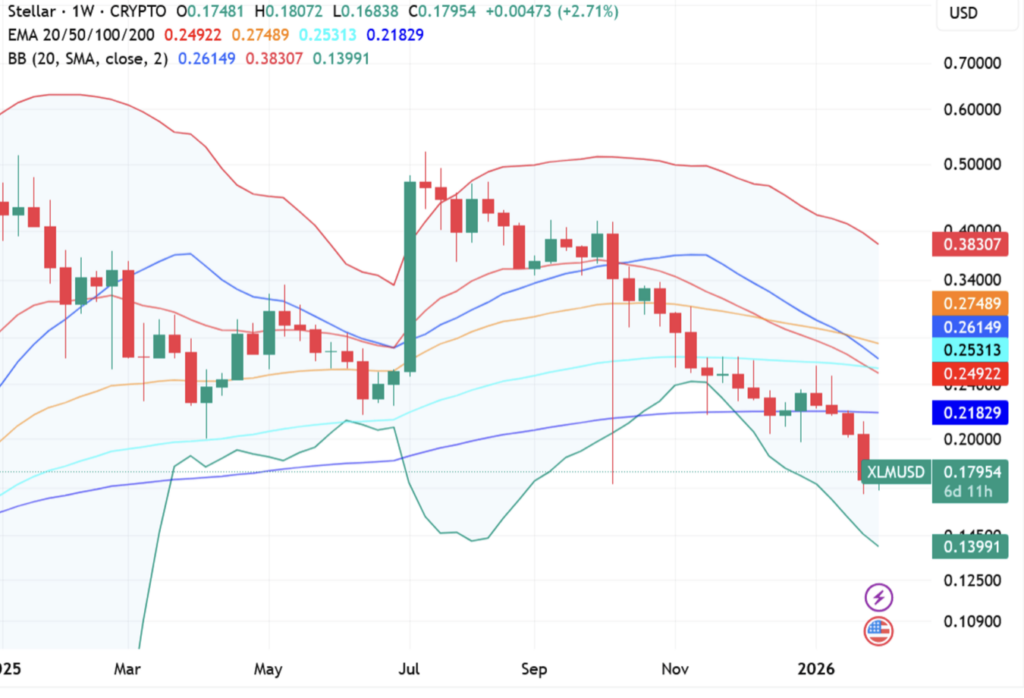
Weekly structure keeps pressure on Stellar price
On the weekly chart, XLM continues to trade inside a prolonged bearish structure that has been in place since mid-2025. Lower highs and lower lows remain intact, and price is still sitting below all major moving averages, including the 20, 50, 100, and 200 EMAs. That positioning reinforces the idea that sellers continue to dominate on higher timeframes.
Bollinger Bands show price lingering near the lower range, close to the $0.14 area, which points to sustained downside pressure rather than a full capitulation event. Overhead, strong resistance is stacked between $0.25 and $0.26, where the Bollinger midline and several EMAs converge. Bulls would need to reclaim this zone convincingly to even begin shifting the long-term structure.
Downside levels still matter despite the bounce
If selling pressure returns, immediate downside targets sit around $0.17, followed by the $0.14 region. A deeper breakdown could expose the $0.11 to $0.12 range, which would likely test long-term holder conviction. From a structural perspective, XLM would need to secure a weekly close above $0.22 first, and then push beyond $0.26, to open the door for a more meaningful upside move.
Until that happens, rallies may remain vulnerable to rejection. The current bounce has helped stabilize price, but it has not yet changed the broader technical picture.
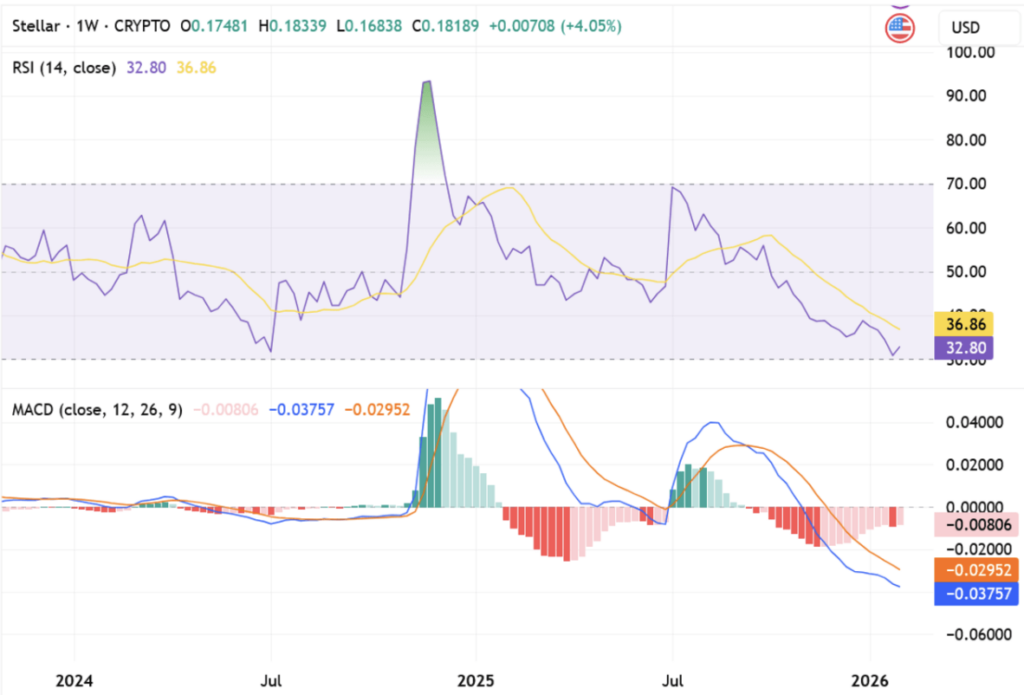
Momentum indicators show improvement, but not a trend shift
Momentum indicators are showing small signs of life, though they still lean in favor of sellers. On the weekly timeframe, the RSI sits around 32.8, below its moving average near 36.8, signaling weak momentum and mildly oversold conditions. For a stronger rally to take hold, RSI would likely need to reclaim the 40 level.
The MACD remains in negative territory, with the main line still below the signal line. While the histogram bars are shrinking, hinting that selling pressure may be easing, there is no confirmed bullish crossover yet. That leaves the market in a wait-and-see phase, where follow-through matters more than single green candles.
Why these levels matter for traders
For traders watching XLM closely, the resistance zones at $0.22 and $0.26 remain key. Failure to break through these areas could see price drift back toward $0.17 or even $0.14. On the flip side, a clean break and hold above $0.26 would change the tone entirely, potentially opening a move toward the $0.38 to $0.40 region.
Until then, caution is still warranted. Short-term momentum has improved, yes, but the long-term structure hasn’t given bulls the green light just yet.