- Chainlink fell roughly 22% in late January, breaking a long-held support zone and pushing RSI to its lowest level since 2022.
- Despite the sell-off, taker buying and accumulation remained elevated, suggesting continued institutional interest.
- Liquidity clustering and a surge in supply held at a loss point to a potential late-stage correction rather than early breakdown.
Chainlink took a sharp hit in the final days of January 2026, sliding roughly 22% and shaking confidence in what had been a steady multi-month uptrend. The move caught traders off guard, especially given how clean the trend had looked just weeks earlier. Suddenly, the question shifted from continuation to durability.
The sell-off sliced straight through the $10.6–$11.75 support zone, an area that had held firm since mid-November 2025. That range also lined up closely with key Fibonacci retracement levels, which made the breakdown harder to ignore. Once it gave way, momentum accelerated fast.
At the same time, LINK’s Relative Strength Index dropped to its lowest reading since 2022. The timing wasn’t isolated either. Bitcoin slipping below $85,000 added fuel to the fire, tightening liquidity and pushing the broader market into a risk-off posture. Altcoins, including Chainlink, absorbed the pressure quickly.
Even so, the speed of the decline has left traders debating what this move really represents. Is this capitulation, or just the opening phase of a deeper correction? The data isn’t giving a single, clean answer yet.
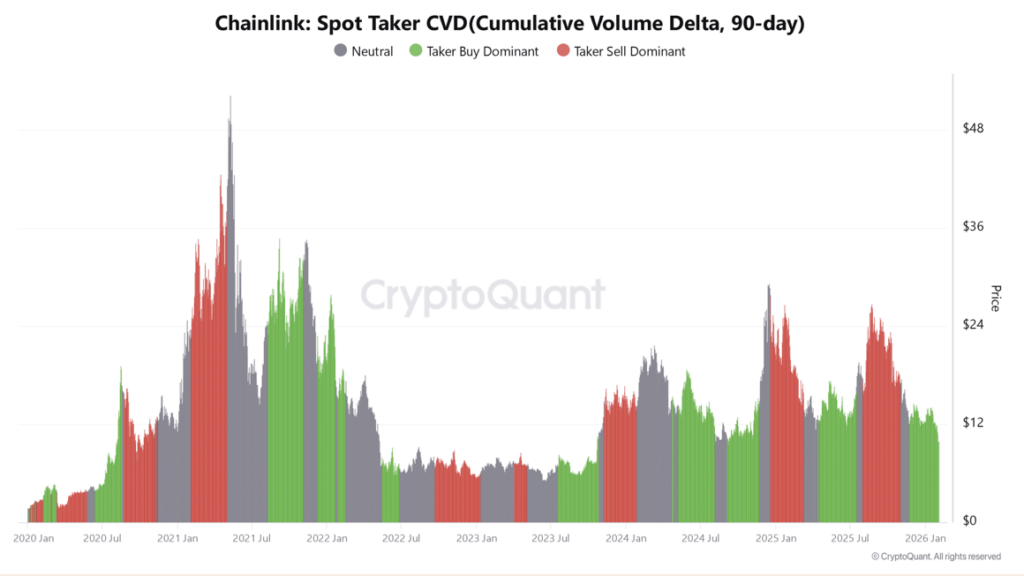
Taker Buying Persists Despite Price Weakness
According to CryptoQuant, something interesting has been happening beneath the surface. Even after LINK dropped toward $13 back in November 2025, the Taker Buy Dominant metric remained elevated. In simple terms, aggressive buying didn’t disappear as price fell.
This behavior suggests that larger players viewed the pullback as an opportunity rather than a warning sign. Institutional accumulation appears to have continued, driven by the belief that Chainlink was undervalued relative to its long-term role in the market. Price was falling, but interest wasn’t.
That disconnect matters. It shows LINK’s underlying narrative and utility haven’t been abandoned, even as short-term sentiment cooled.
Liquidity Builds as Downside Momentum Slows
Liquidation data adds another layer to the picture. CoinGlass heatmaps revealed dense liquidity clusters between $12 and $13 during the late-January sell-off. Price repeatedly dipped into that zone, bounced, then returned again, suggesting buyers and sellers were actively battling for control.
For now, sellers still hold the broader trend. But a reclaim above $11 could shift the balance. That level would likely attract liquidity-seeking flows and trigger short covering, potentially opening a path back toward $13. Until that happens, upside attempts remain fragile.
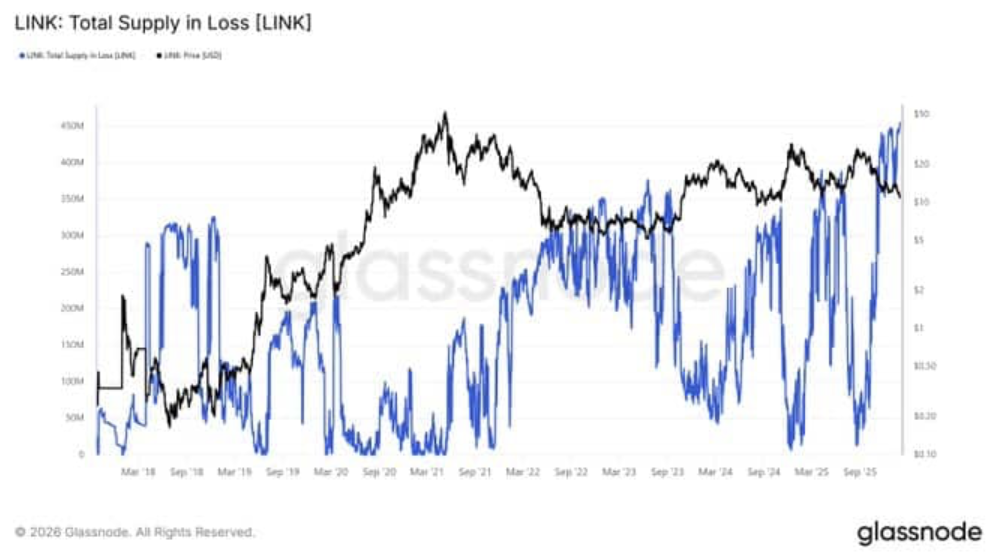
Supply in Loss Nears Historical Extremes
Glassnode data shows that the total supply of LINK sitting in loss surged toward 400 million tokens. That means a significant portion of holders are currently underwater, a condition that has historically marked late-stage sell-offs rather than early ones.
During the 2022 market downturn, a similar spike in supply held at a loss preceded a strong recovery. It doesn’t guarantee a repeat, but it does suggest selling pressure may be approaching exhaustion.
Given Chainlink’s role as core infrastructure across the blockchain ecosystem, these signals point to a market that may be closer to a bottom than a breakdown. Whether price confirms that with a reversal is still unclear, but the conditions for one are quietly taking shape.