
- XRP is testing a critical monthly support near $1.60 and the 33 EMA, which could determine the next major trend move.
- A breakdown would signal a corrective phase rather than the end of XRP’s long-term upside, according to EGRAG CRYPTO.
- Historical XRP cycles show that similar corrections have often preceded powerful rallies once selling pressure is absorbed.
XRP is sitting at a critical point, where the outcome of its monthly close could shape the next major leg in either direction. According to crypto analyst EGRAG CRYPTO, the current structure places XRP right on a decision zone that has historically defined long-term moves. His latest chart lays out several key technical levels that may decide how the coming months unfold.
The analysis centers on XRP’s relationship with the 33 EMA, a long-term trend reference, and a central trend line that has guided price action through multiple cycles. Together, these levels frame a scenario where upside remains possible, even if short-term weakness continues.
Current Structure and Critical Thresholds
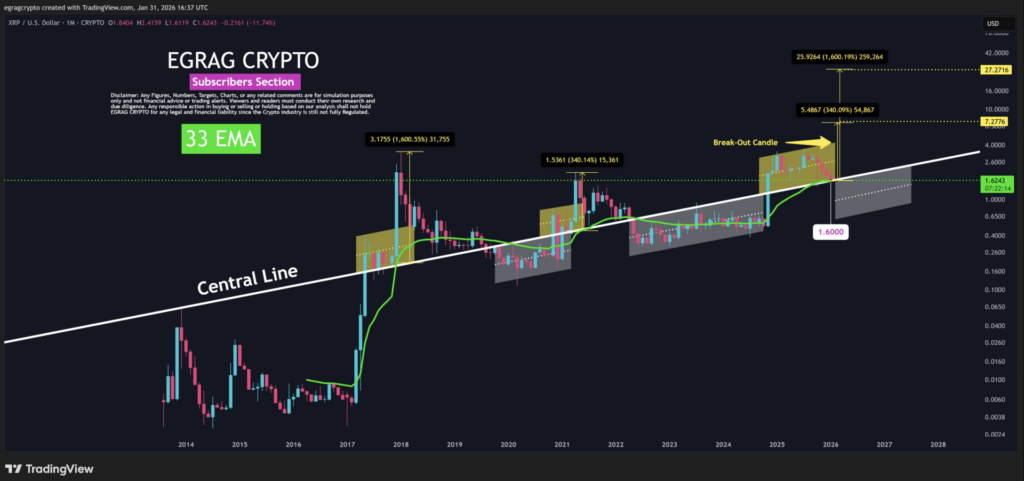
Based on the chart, XRP is testing a crucial monthly support near $1.6. A close below this level, especially if it also breaks beneath the 33 EMA, would signal structural weakness in the current trend. EGRAG CRYPTO stresses that such a move wouldn’t mark the end of XRP’s upside story, but rather confirm a corrective phase.
As he puts it, selling after structure breaks is often how traders miss the real move. The idea is less about reacting to fear, and more about understanding how markets reset before pushing higher. Corrections, in this context, are part of the process, not the conclusion.
The central trend line shown on the chart runs through several historical turning points. Time and again, this line has acted as a pivot for both major rallies and deeper pullbacks. Holding above $1.6 and the 33 EMA could open the door to strong upside momentum, while a break below would likely trigger short-term panic selling and liquidity rebalancing.
Historical Precedents for XRP Rallies
EGRAG CRYPTO also compares the current setup to previous XRP cycles. A bounce from the $1.6 area could resemble the 2021-style rally, which delivered gains of roughly 340% and pushed price toward the $7 region. It’s not a prediction, more of a structural reference.
A more aggressive scenario mirrors 2017, when XRP surged by nearly 1,600%, targeting levels around $27. What’s notable is that both historical rallies unfolded without a broad market-wide bull run. Instead, they were driven by oversold conditions, compressed price action, and a release of built-up pressure.
The chart highlights consolidation zones that formed ahead of those explosive moves. During those periods, price looked dull and directionless, until suddenly it wasn’t. According to EGRAG CRYPTO, confirmed trend weakness during corrections often sets the stage for outsized gains later, reframing pullbacks as resets rather than failures.
What’s Next for XRP?
Looking ahead, EGRAG CRYPTO points to forced selling and fear-driven corrections as necessary ingredients in the cycle. By absorbing that selling pressure, XRP can clear excess leverage and reset liquidity. It’s uncomfortable, but historically effective.
In the most likely scenario, XRP may briefly dip below $1.60, triggering panic selling and marking the end of the current phase. That reset, if it plays out, could create the conditions for the next major move once the market stabilizes. For now, the monthly close matters more than any single intraday candle, and the chart is doing most of the talking.