
- Dogecoin fell to around $0.1012 after a sharp selloff, pushing price back into a historically important demand zone.
- Short-term traders are watching whether buyers can hold support near $0.11, with upside targets forming if the level holds.
- Weekly charts suggest Dogecoin is testing long-term support, where a breakdown could lead to extended consolidation.
Dogecoin saw a sharp move lower on Saturday, sliding to around $0.1012 after dropping 13.13% in the past 24 hours. Over the past week, losses are now close to 19%, based on market data from CoinMarketCap. The sudden pullback has shifted sentiment quickly, especially among short-term traders.
The decline has pushed DOGE back into a price zone that has historically acted as a major inflection point. That area has often marked either the start of relief rallies or deeper drawdowns, which is why it’s drawing renewed attention. Both short-term traders and longer-term market watchers are now watching closely, maybe a bit cautiously.
Short-Term Demand Zone Under Pressure
Crypto trader Erick Crypto noted on January 31 that Dogecoin is approaching an important demand zone near $0.11. From a short-term price perspective, the recent selloff cleared out liquidity, after which a base began to form. This kind of structure has appeared before during periods of market stress.
In previous cycles, similar setups sometimes led to relief rallies once conditions stabilized. If buyers manage to hold this area, traders may start watching for upside moves toward $0.14, $0.18, and potentially $0.22. These levels align with earlier congestion zones where selling pressure had previously built up.
Still, the setup remains fragile. Any decisive break below current levels could quickly undermine hopes for a short-term recovery, especially if volume accelerates on the downside.
Dogecoin Weekly Chart Signals Ongoing Bear Cycle Risk
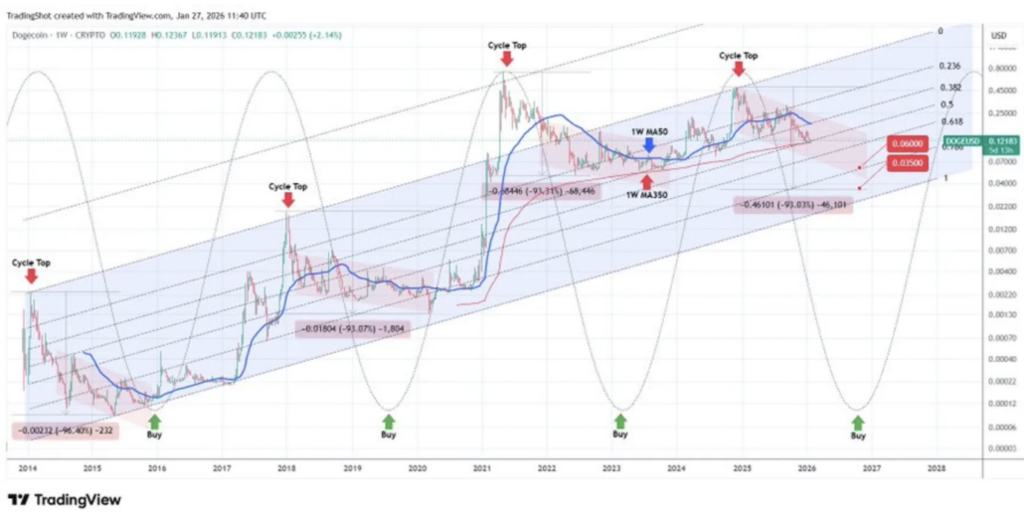
Looking at a broader timeframe, TradingShot stated on January 27 that Dogecoin appears to be entering a new bear market phase. At present, the price is leaning on the 1-week MA350 as support, a level that has played a key role in past cycles.
This moving average has held since the October 2025 flash crash and has previously marked major cycle bottoms. Because of its long-term relevance, it remains a critical level for traders focused on structural trends rather than short-term noise.
If DOGE breaks below this support, it could open the door to an extended consolidation phase. Historically, losing similar weekly support levels has pushed Dogecoin into long stretches of low volatility, with price action ranging roughly between $0.0600 and $0.0350.
Long-Term Cycle Structure Remains in Focus
Despite the recent downside, the long-term DOGE/USD chart still shows price moving within a rising logarithmic trend channel that dates back to 2014. This structure highlights Dogecoin’s tendency to move in distinct growth and decline cycles, rather than straight-line trends.
In prior cycles, major tops formed near the upper boundary of this channel, while deep corrections often pushed price toward the lower end, sometimes after drawdowns of 90% or more. Those extremes have historically defined long-term opportunity zones.
At present, Dogecoin is reacting around key Fibonacci retracement levels between 0.5 and 0.618 of the broader move. In past cycles, this region has often determined whether price stabilizes and resumes its larger trend, or slips further toward the bottom of the channel. The next few weeks could prove decisive, even if the market feels quiet on the surface.