
- Cardano is testing key support near $0.32 after breaking January’s range
- Whale accumulation and exchange outflows suggest longer-term buying interest
- A loss of $0.32 could open a move toward $0.30, while $0.35 remains first resistance
Cardano is trading near $0.32 on January 30, 2026, pressing into the lower edge of a support zone that has quietly shaped its trend for weeks now. This area feels like a decision point more than just another dip, with buyers needing to show up or risk a deeper slide toward $0.30. The tone across the market is cautious, and ADA isn’t being given much room to breathe.
Over the last 24 hours, ADA dropped roughly 7%, sliding from an intraday high near $0.35 down toward $0.32. Trading volume picked up during the move, reaching around $715 million, while Cardano’s market cap settled near $11.9 billion, keeping it around the 12th spot among cryptocurrencies. The sell-off erased most of the gains from early January, when ADA briefly pushed toward the $0.40 area.
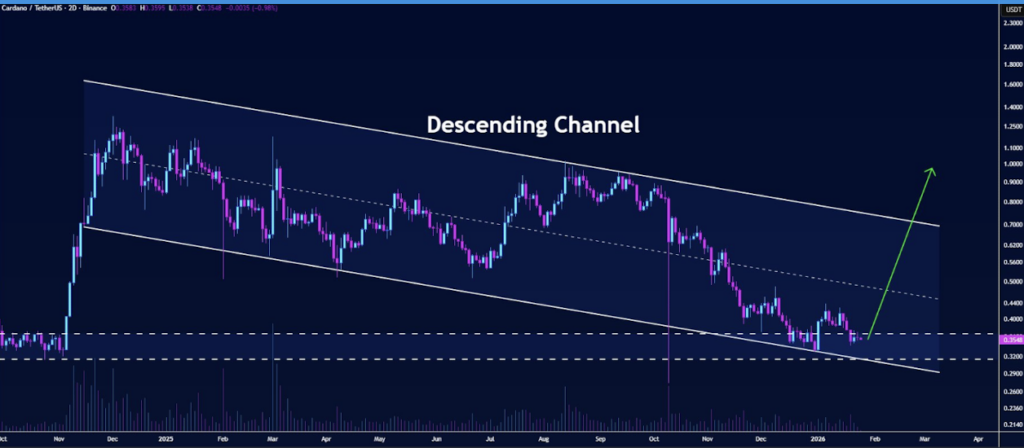
Descending Channel Keeps Pressure on Price
Recent price action shows ADA losing the $0.33 level that had acted as support for most of January. The token briefly dipped to around $0.322 before stabilizing, but the damage to structure is still visible. From a technical perspective, Cardano remains stuck inside a descending channel, with lower highs and capped rallies defining the trend.
Price is trading well below key moving averages, and the 200-day EMA near $0.41 continues to act as overhead resistance. Any recovery attempt is likely to run into friction between $0.38 and $0.40, where the downtrend line intersects. Until that zone is reclaimed, upside moves may continue to fade a bit faster than bulls would like.
Whales Accumulate as Selling Pressure Builds
Despite the weak chart, on-chain data adds a more balanced layer to the picture. Whale and institutional-sized addresses have been net accumulators during January’s pullback, with large buy orders clustering around the $0.34 to $0.35 range. That activity suggests some longer-term players are comfortable building positions slightly above current prices.
Exchange balance data supports this view, showing net outflows over recent weeks as tokens move off exchanges into longer-term storage. This behavior usually points to accumulation rather than panic selling. Staking participation also remains high relative to circulating supply, which helps reduce immediate sell pressure, even if price doesn’t react right away.
Support, Resistance, and What Comes Next
From a structural standpoint, the $0.32 to $0.33 area is now the main level to watch. A daily close below this zone would likely shift attention to $0.30, which marks both a psychological level and the lower boundary of the descending channel. That area has acted as demand in prior cycles, but it hasn’t been tested in a while.
On the upside, initial resistance sits near $0.35. A reclaim there would be the first sign that sellers are losing control. Beyond that, the $0.38 to $0.40 region remains the key barrier for any meaningful trend shift. Volume data shows $0.35 as the heaviest traded zone in the recent range, and price currently sits below it, suggesting ADA is operating in a demand area rather than strength.
Derivatives data shows funding rates hovering around a modest 0.01% per eight hours, with open interest cooling off to roughly $680 million. Traders appear to be stepping back rather than aggressively shorting, which fits with the broader consolidation feel. For now, ADA remains at the lower end of its January range, and whether $0.32 holds may decide how the next leg plays out.