
- XRP is trading near $1.42 despite bullish crypto headlines, including potential U.S. regulation clarity and a Japan-based XRP bond launch.
- On-chain data shows $1.93 billion in realized losses, signaling capitulation that has historically aligned with local bottoms.
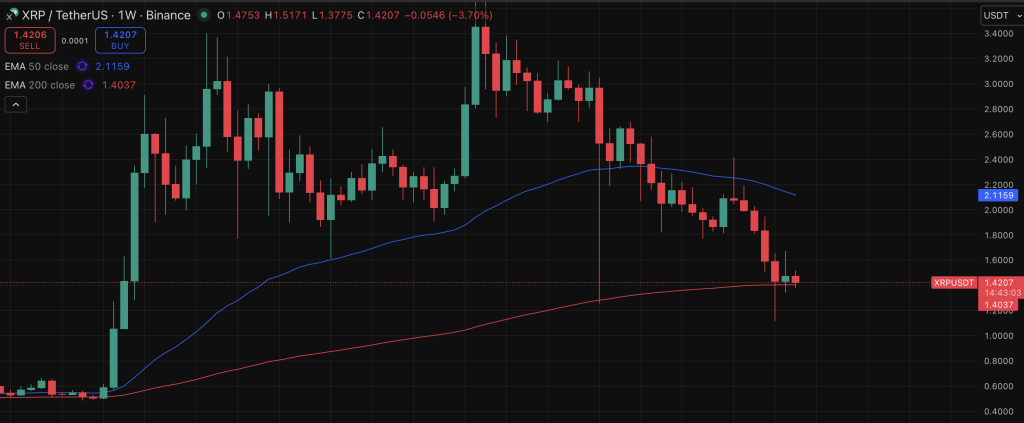
- The $1.40 level is key support, with $1.55 and $1.70 above, while a breakdown could send XRP back toward $1.25 or $1.11.
Ripple’s XRP is stepping into the week with a strange split personality. On one side, the headlines look almost bullish. Brad Garlinghouse recently said there’s a 90% chance that U.S. crypto legislation gains clarity by April, a development that could finally unlock deeper institutional participation. In Japan, SBI launched a $64.5 million bond that rewards investors with XRP, blending the token into a traditional financial wrapper, which is no small thing.
And yet, the price action tells a different story. On-chain data shows roughly $1.93 billion in realized losses, a figure that suggests heavy capitulation. Historically, moments like this have aligned with local bottoms, when sellers are exhausted and sentiment feels washed out. Still, XRP is hovering around $1.42, and the chart doesn’t exactly scream recovery. Not yet.
What the XRP Chart Is Really Saying
On the 4-hour chart, the trend has been unmistakably lower. XRP has carved out a series of lower highs and lower lows for weeks, gradually bleeding down to $1.11 before staging a modest bounce. Now it sits slightly above $1.40, clinging to that level like it matters, because it does.
The $1.40 zone has become short-term support, at least for now. Price is consolidating there after the recent sell-off, moving sideways in a way that feels more like hesitation than strength. If this floor gives way, the path back toward $1.11 opens up quickly. At the moment, the market looks paused, not reversed, and there’s a difference. A big one.
Indicators Show Caution, Not Conviction
Positioning data reveals that short exposure has been slowly increasing. Traders, at least in the short term, seem more comfortable betting on downside continuation rather than a breakout. That shift in sentiment adds pressure, especially when momentum indicators aren’t offering much relief.
The Commodity Channel Index (CCI) remains negative, signaling weak momentum without reaching extreme oversold territory. In other words, there’s no clear sign that aggressive buyers have stepped in. Meanwhile, the Average True Range (ATR) has cooled off after the sharp drop, suggesting volatility has normalized. Often, that calm comes before the next big move, though direction is still uncertain.
Key Levels That Could Decide the Week
If XRP can hold above $1.40, upside targets begin to stack up. First comes $1.55, then $1.70, and above that, the $1.90 to $2.00 region becomes realistic. But that bullish path depends entirely on defending current support, and that defense hasn’t been convincingly tested yet.
On the downside, a break below $1.40 could send XRP toward $1.25 fairly quickly. After that, the $1.11 low becomes the line in the sand. Losing that level would likely confirm another leg down, extending the broader downtrend. For now, XRP is sitting at a decision point. Regulatory optimism and institutional headlines are building quietly in the background, but the chart still demands proof before any real recovery can begin.