
- Ethereum remains in a corrective range between support near $2,700 and resistance around $3,500
- Technical structure points to limited upside while ETH trades below key moving averages
- Negative Coinbase premium suggests cautious U.S. and institutional spot demand
Ethereum remains stuck in a corrective phase after failing to hold its early-month push above the mid-$3,000s. What looked like a potential breakout has faded, with price now oscillating between a higher-timeframe demand area near $2,700 and a wide supply zone closer to $3,500. Overhead moving averages continue to act as a ceiling, keeping upside attempts in check for now.
This kind of structure doesn’t inspire strong conviction in either direction. Instead, it puts added weight on how ETH behaves around nearby support as the pullback unfolds. Small reactions here matter more than usual.
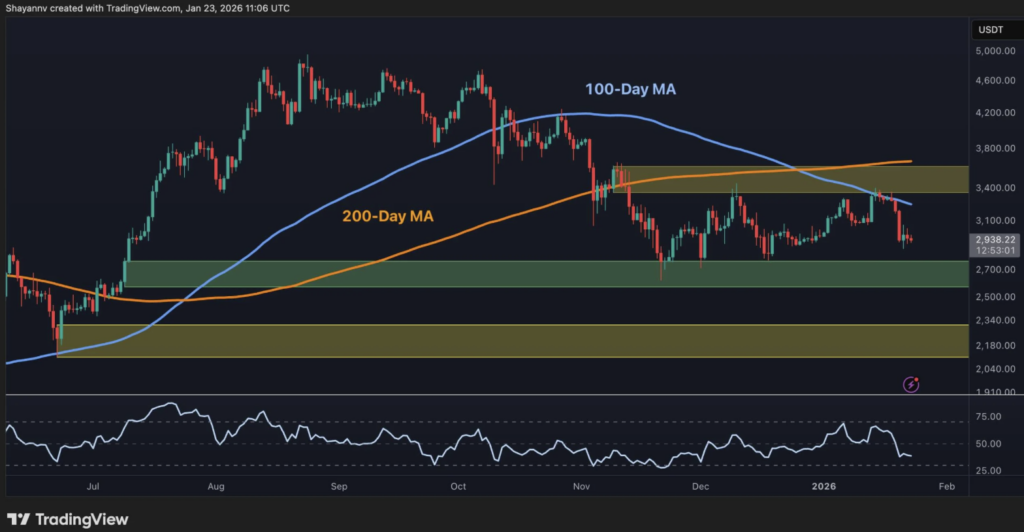
Daily Chart Shows Resistance Still in Control
On the daily timeframe, Ethereum has once again been rejected from the confluence of the $3,500 resistance zone and the declining 100-day moving average. The 200-day moving average remains higher, around $3,800, and has begun to flatten, another sign that momentum has cooled rather than flipped bullish.
The drop back below the 100-day moving average reinforces the idea that ETH is still correcting, not trending higher in a clean, impulsive way. Attention now shifts to the $2,700 demand region, highlighted by prior buying interest. A sustained hold above this zone would help prevent further downside and keep the door open for another attempt toward $3,500. On the other hand, a daily close below $2,700 would likely signal a deeper mean-reversion move, potentially toward the lower support band near $2,200.
Lower Timeframes Confirm the Breakdown
Zooming into the 4-hour chart, the picture becomes clearer. Ethereum has broken down from the rising channel that carried price from roughly $2,800 to a recent high near $3,400. Once the lower boundary of that channel gave way, along with local support around $3,000–$3,100, the structure shifted decisively bearish.
Price is now printing lower highs and lower lows, while momentum indicators like the RSI have only managed a modest bounce from oversold levels. The immediate pivot to watch sits around the former breakdown zone at $3,000–$3,100. A recovery and consolidation above that area would hint at a failed breakdown and open the path back toward $3,400. Continued rejection there, though, keeps pressure on $2,900 first, and then the broader $2,600–$2,700 demand zone.
Sentiment Remains Soft as U.S. Demand Lags
Sentiment data adds another layer to the story. Ethereum’s Coinbase Premium Index has turned decisively negative over the past few weeks, with persistent red readings showing ETH trading at a discount on Coinbase relative to Binance. That typically points to weaker buy-side interest from U.S. and institutionally skewed participants.
Historically, extended negative premiums can sometimes mark the tail end of local selling, as weaker hands exit and offshore demand quietly absorbs supply. That can set the stage for a recovery later on, assuming liquidity or narrative support returns. For now, however, the sustained discount supports the view that this downswing is being driven not just by technical resistance, but also by a cautious stance among U.S. spot buyers.