
- XLM price is compressing above the $0.18–$0.22 demand zone, signaling absorption rather than breakdown
- On-chain data shows heavy short positioning clustered between $0.23 and $0.25
- Reduced exchange flows suggest selling pressure is fading as the market builds a base
After weeks of slow movement and repeated failures near resistance, Stellar (XLM) still looks stuck in a structure that leans bearish at first glance. Momentum has been missing, and that alone has kept many traders on the sidelines, especially with the broader crypto market struggling to hold a clear direction.
But markets rarely stay quiet for no reason. Beneath the surface, something is starting to shift. XLM price continues to hold firm near the demand zone around $0.20, and derivatives positioning suggests traders may be leaning a little too hard in one direction. The real question now isn’t why Stellar looks weak, it’s whether the market is misreading what comes next.
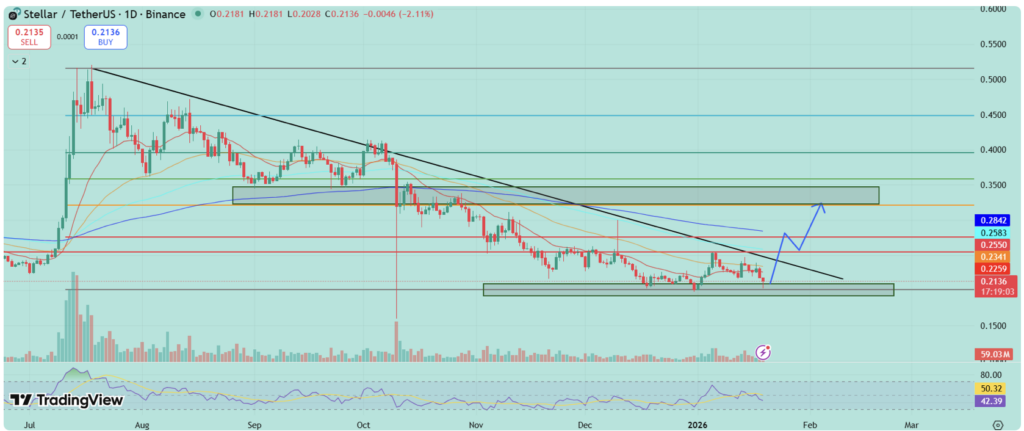
XLM Price Compresses Above Key Demand
XLM’s current behavior looks less like trend continuation and more like compression. After drifting lower toward the $0.20 region, price stabilized inside the $0.18–$0.22 demand zone, an area that has quickly turned into short-term structural support.
That matters. Instead of accelerating lower, the market appears to be absorbing sell pressure. On the chart, volatility has contracted and momentum has flattened, rather than pushing deeper into bearish territory. This kind of tightening often shows up before expansion, not after.
On the upside, the $0.25–$0.26 range stands out as the first area where price could gain traction. A clean move through that zone would bring $0.30 back into focus fairly quickly. Beyond that, the structure opens toward the $0.30–$0.35 region, where prior supply is clustered. As long as XLM holds above $0.20, the setup favors resolution higher over another clean breakdown.
On-Chain Signals Suggest Pressure Is Building
On-chain data is where things start to get more interesting. The Binance XLM/USDT liquidation map shows a growing concentration of leveraged short positions stacked between $0.23 and $0.25. That creates a clear short-side liquidity pocket. If price pushes into that zone, short sellers could be forced to cover, adding fuel to any upside move.
At the same time, spot flow data supports the idea that selling pressure is easing. After months of steady exchange inflows during the distribution phase, recent sessions show reduced net outflows. Fewer tokens moving to exchanges usually signal a drop in intent to sell, something that often appears during accumulation or base-building phases.
Historically, Stellar has reacted sharply when declining spot outflows line up with heavy short positioning. The chart may still look heavy, but the positioning underneath suggests the market could be leaning aggressively bearish at exactly the wrong time.
The Calm Before a Reaction?
For now, XLM sits in a waiting phase. Price hasn’t broken out, but it also hasn’t broken down. That balance won’t last forever. If Stellar starts to push into areas where shorts are crowded, the reaction could be far sharper than the current calm implies.
Sometimes the quietest charts carry the most tension.