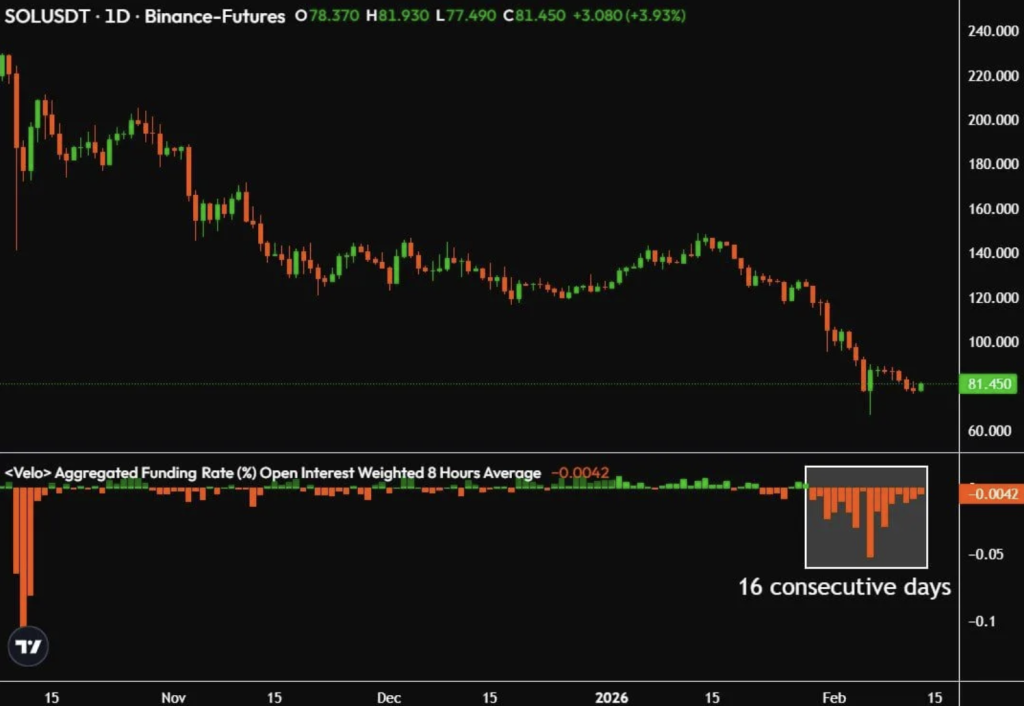
- Solana futures funding rates remained negative for 16 straight days, signaling sustained short positioning across derivatives markets.
- SOL broke down from a long-held trading range and is now attempting to stabilize near the $80 level.
- Extended negative funding can lead to short squeezes, but the broader price structure remains tilted to the downside.
Solana’s derivatives market has been throwing off warning signs for a while now. Funding rates stayed negative for more than two straight weeks, which doesn’t happen often, and it’s hard to ignore. At the same time, SOL has been trying, somewhat awkwardly, to steady itself around the $80 mark after slipping out of a trading range it held for what felt like ages.
Prolonged Negative Funding Signals Heavy Short Bias
Futures funding rates for Solana remained negative for 16 consecutive days, based on an aggregated open interest weighted eight hour average shown on a Binance Futures daily chart dated Feb. 15. The reading hovered near minus 0.0042, meaning short traders were effectively paying longs to keep their positions open. Meanwhile, SOL traded around $81, still digesting a multi week slide that kicked off toward the end of 2025 and never really found solid footing.
Funding rates, in simple terms, reveal which side of the market is more aggressive in perpetual futures. When they stay negative for this long, it suggests traders are leaning short across major venues, not just in isolated pockets. What makes this stretch stand out is that similar periods have only shown up twice before in Solana’s history, once in November 2022 when SOL was near $8 during a brutal market selloff, and again in September 2023 when price drifted around $20 under generally weak sentiment.
Even so, funding by itself doesn’t dictate direction. It adds context, that’s all. Extended negative readings can point to crowded short positioning, and when that happens, sharp rebounds sometimes force shorts to cover quickly, fueling sudden spikes higher. But that’s potential, not certainty, and the broader trend still needs to confirm any shift.
Price Structure Remains Under Pressure
On the daily timeframe, SOL has continued to carve out lower highs and lower lows, which is rarely a good look. Attempts to bounce have repeatedly stalled beneath former support levels that now act as resistance, flipping the script in a way that keeps sellers firmly in control. The latest session showed a modest bounce, sure, but zooming out, the structure still leans weak compared to where it stood just a few months ago.
The three day SOL/USDT chart from Binance, dated Feb. 13, shows price hovering around $80 after breaking down from a long standing range that supported it through much of 2024 and 2025. That green support band in the low $120s finally gave way, and once it did, the drop accelerated into early 2026. Price extended toward the high $70s before buyers stepped in, somewhat cautiously, to defend that zone.
Volume expanded sharply during the breakdown, lining up with the largest red candles in the sequence, which usually reflects heavier conviction on the sell side. More recently, however, candles near $80 have printed longer lower wicks, hinting at buying interest even as the broader structure remains fragile. For now, SOL sits below the broken range, with overhead resistance still looming above and a lower reference band around the high $60s waiting beneath. If $80 holds, it could mark the first real pause in this decline. If it doesn’t, the next leg lower might come faster than many expect, and that’s just the reality of it.