- SHIB remains trapped in a descending channel with sellers firmly in control
- Weak momentum, net spot outflows, and stacked EMAs limit upside attempts
- Key levels to watch are $0.0000086 on the upside and $0.0000078 on the downside
Shiba Inu is trading around $0.00000823, and the chart isn’t being subtle about what’s happening. Price continues to slide inside a clearly defined descending channel, with sellers maintaining control and buyers struggling to do much more than slow things down. Spot outflows and weak momentum aren’t helping either, keeping sentiment heavy.
So far, every attempt at a bounce has felt tentative. SHIB keeps hovering near near-term support, but there’s no real follow-through. For now, the market looks cautious, almost tired, and that usually favors the prevailing trend.
Descending Channel Still Dictates the Bigger Picture
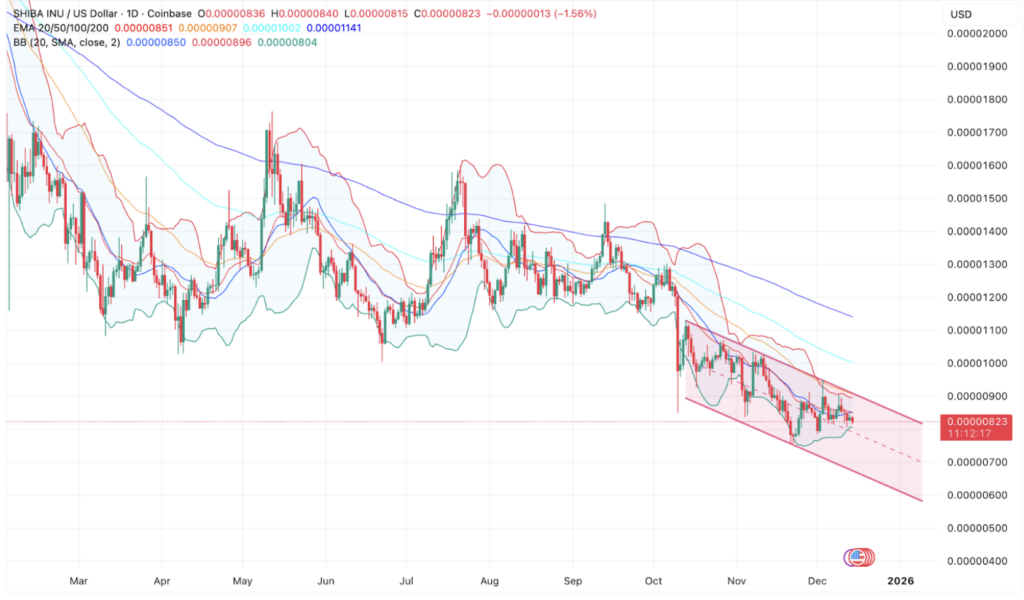
On the daily chart, SHIB remains locked inside a downward-sloping channel that’s been in place since early October. Each rebound over the past couple of months has stalled below the upper boundary, reinforcing the idea that selling pressure hasn’t gone anywhere. The structure is doing its job, pushing price lower step by step.
SHIB is also trading below the 20, 50, 100, and 200-day EMAs, all stacked above price. That alignment keeps the bias firmly bearish and limits the chances of any sustained upside. The 200-day EMA near $0.0000114 sits far overhead, a reminder of how much ground would need to be reclaimed to even start talking about a broader trend shift.
On the downside, the lower channel boundary comes in around $0.0000078 to $0.0000076. If selling resumes with conviction, that zone becomes the next critical test. A break there would likely put the psychological $0.0000070 level in play, where buyers may finally try to make a stand.
Short-Term Charts Show Buyers Losing Steam
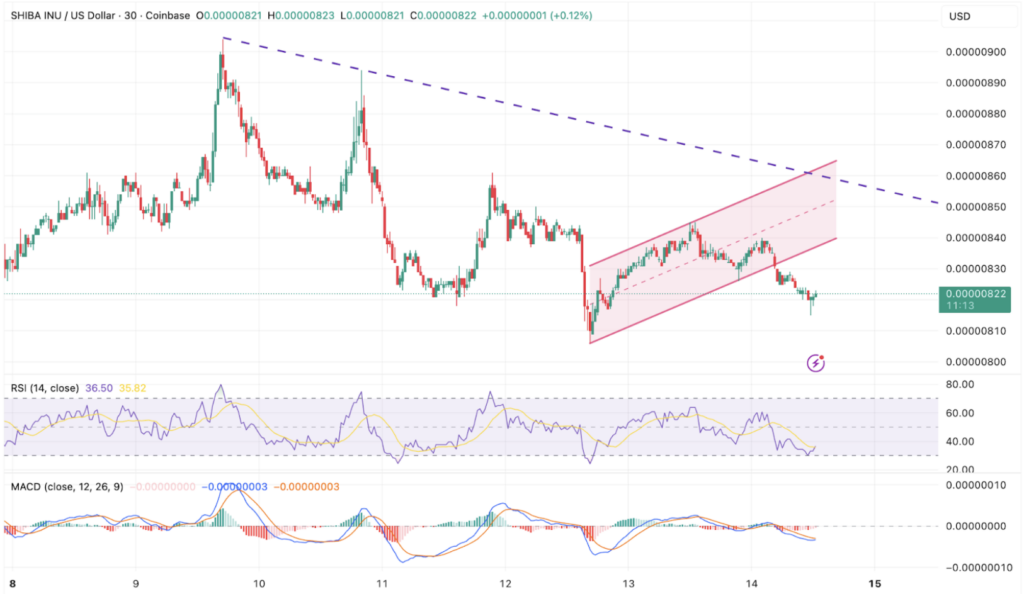
Zooming into the lower timeframes doesn’t change the story much. On the 30-minute chart, SHIB briefly attempted a recovery within a small rising channel, but that structure is already breaking down. Price is drifting back toward the lower end of the intraday range, suggesting the bounce didn’t have much strength behind it.
RSI on these shorter timeframes sits in the mid-30s, pointing to weak demand rather than panic selling. Momentum hasn’t reset higher, and sellers keep stepping in quickly on every bounce. MACD remains flat to slightly negative, with no real bullish crossover to speak of. This looks more like a pause than a reversal, honestly.
Spot flow data adds another layer of pressure. Recent sessions show consistent net outflows, with the latest daily reading near negative $600,000. That suggests SHIB is still moving onto exchanges rather than into long-term storage, which tends to cap upside attempts.
Burn Spike Fails to Move the Needle
Shiba Inu’s burn rate jumped more than 1,500% over the past day, with roughly 1.1 million tokens removed from circulation. On paper, that’s a big percentage move. In practice, the absolute number is still tiny relative to SHIB’s massive supply.
The market barely reacted. Traders seem to be discounting short-term burn data and focusing instead on broader conditions, where risk appetite remains weak. Burn activity may support the long-term narrative, but right now it’s not acting as a catalyst.
All Eyes on Upcoming Coinbase Developments
Looking ahead, attention is shifting to Coinbase. The exchange is set to launch U.S. perpetual-style futures for select altcoins, including SHIB, on December 15. There’s also a teased system update on December 17 that the community is watching closely.
These events could inject volatility and boost activity, but they don’t automatically flip the trend. In markets like this, catalysts usually amplify what’s already happening rather than reverse it outright.
Outlook: Where SHIB Goes From Here
As long as SHIB trades inside the descending channel, the structure stays bearish. A bullish case only starts to form if price reclaims $0.0000086 and closes above the channel midpoint with improving volume, opening the door toward $0.0000095. Until then, downside risk remains very real.
A daily close below $0.0000078 would confirm continuation lower and expose $0.0000070 as the next demand zone. Holding around $0.0000080 keeps consolidation alive, but losing it likely extends the downtrend into year-end.