- BONK rallied 5.55% even as daily volume fell nearly 10%, with upside possibly fueled by Bonk.fun’s new 51% buyback fee allocation.
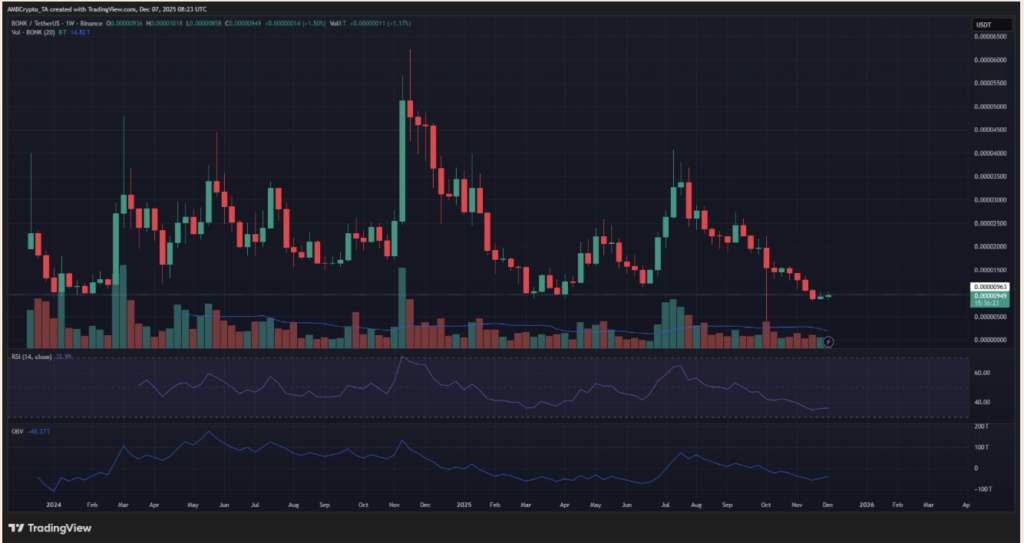
- The token lost its long-held $0.0000096 support on the weekly chart, signaling a strong bearish trend, though short-term charts show accumulation and a stable trading range.
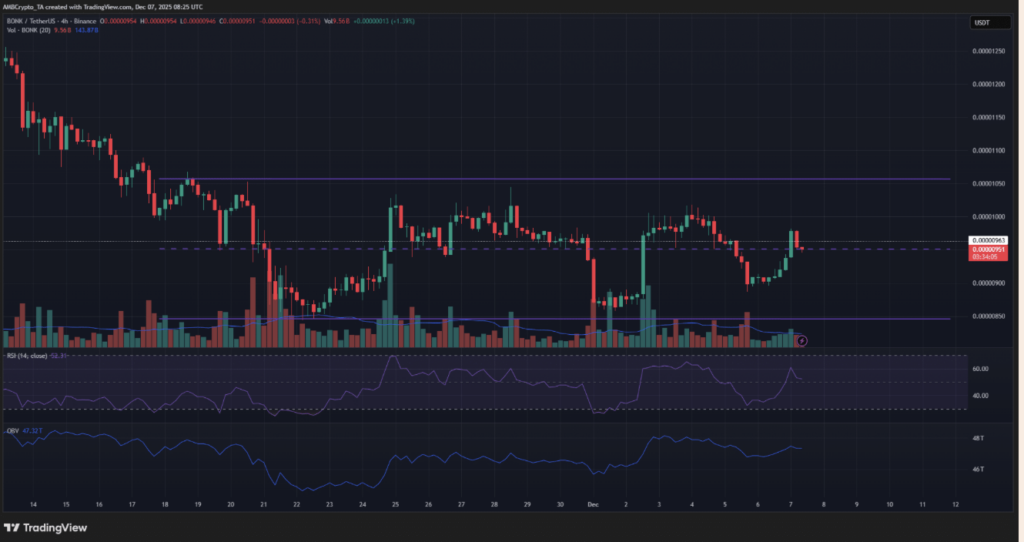
- A breakout above $0.0000105 could target $0.0000135, but rejection at range highs remains more likely unless Bitcoin strength improves.
Bonk managed to squeeze out a 5.55% jump over the last 24 hours, though strangely… trading volume slid almost 10% at the same time, according to CoinMarketCap. It’s a weird mix of energy and exhaustion — the kind of thing meme-coin charts love to throw at you.
Part of that little pump likely came from the new Bonk.fun update on Solana’s ecosystem. The launchpad announced that 51% of its fees will now go toward buying back BONK (a huge step up from the old 10%), giving traders fresh hope that demand might slowly crawl back in.
But looking at the charts… yeah, the situation is still complicated.
BONK Breaks Below a Major Support — And That’s Not Great
On the higher timeframe, BONK is clearly stuck in a downtrend. The $0.0000096 level — a support zone it’s held since early 2024 — finally collapsed two weeks ago. Now that same area is flipping into resistance, and bulls are trying to pretend everything’s fine.
It’s not.
The OBV continues sinking, showing that real sell pressure never went away, and the RSI hovering around 36 confirms strong bearish momentum. This entire structure is the kind of place where bulls normally make a “final stand”… except BONK buyers look like they forgot to show up.
Short-Term Chart Shows a Sliver of Hope
Now, for the optimists — here’s a glimmer of good news.
BONK has been stuck in a horizontal range for about three weeks, between:
- $0.00000846 (range low)
- $0.0000105 (range high)
The downtrend stalled right inside this box. Meanwhile, the OBV on the 4-hour chart is actually trending upward. RSI is flipping back and forth, showing that buyers are trying to fight back, even if they keep getting slapped by resistance.
Still… reversing the larger downtrend is a mountain climb. Losing the $0.0000096 support — especially since it sits just under the psychological $0.00001 line — was a huge confidence breaker.
What a Bullish BONK Scenario Would Look Like
There is a bullish case, even if it’s the less likely one.
- Rising OBV suggests accumulation might be sneaking in.
- A breakout above $0.0000105, followed by a clean retest as support, would be an actual buy signal.
- If that happens, the next real target sits around $0.0000135.
That’s the hopium roadmap — not impossible, just harder to believe until the chart proves it.
The More Realistic Scenario? Respect the Range
Until BONK actually breaks out, traders should treat this as a range market. That means:
- Sell near the range highs ($0.0000105)
- Buy only at the lows ($0.00000846) if you’re brave
- Don’t gamble on breakouts that haven’t happened
A rejection at the top of the range is more likely than a clean breakout. And even if BONK does manage to push higher, its fate will still be tied to broader sentiment — especially Bitcoin’s strength.
Sometimes the simplest rule is the smartest one:
Trade the range until the range dies.