
- New on-chain data shows the November crash was driven almost entirely by Bitcoin liquidations, not Ethereum selling.
- ETH held up better than usual thanks to staking lock-ups and EIP-1559 supply burns, which reduced panic-sell pressure.
- Analysts warn that ETH leverage remains dangerously high, but overall signals point to a BTC-led mid-cycle reset, not an ETH breakdown.
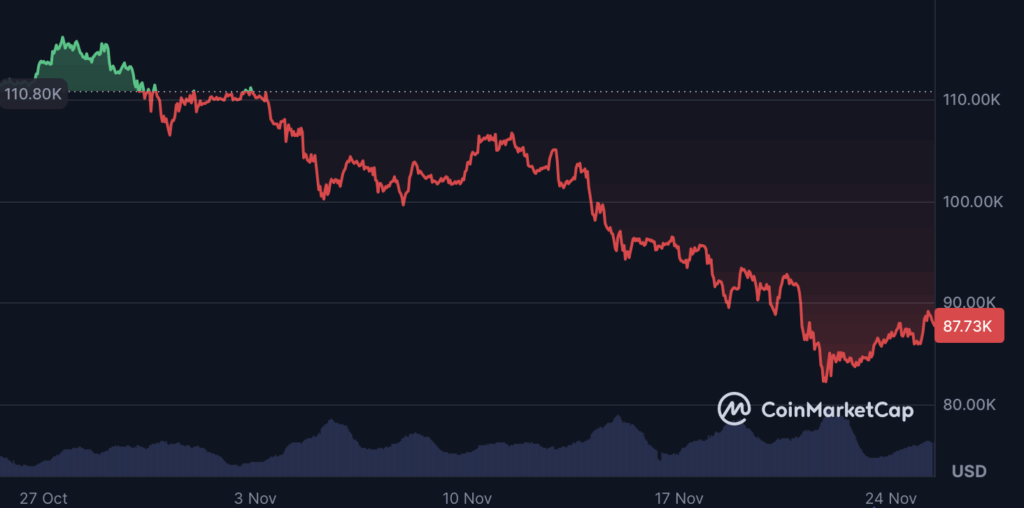
Bitcoin’s brutal wipeout from roughly $107,000 on November 11 down to the $81,000 pocket just ten days later shook pretty much everyone in the market. The candles were violent, the liquidations were messy, and sentiment flipped almost overnight. But digging into the on-chain data? It paints a very different picture than the panic-driven narratives floating around X. This wasn’t an Ethereum collapse at all — it was, almost entirely, a Bitcoin-driven flush.
A Tale of Two Sell-Offs, and They’re Not Equal
Fresh analysis from XWIN Research Japan breaks down the October–November correction, and the split between BTC and ETH is… honestly surprising. If you index both from October 1, Bitcoin slid into the low-70s by late November, while Ethereum only slipped into the high-60s. Normally, a 30% BTC drop drags ETH down 40–50% without fail. This time, the spread stayed narrow — meaning ETH held up better than it usually does during full-blown fear phases.
The on-chain reason is simple enough: ETH supply is tight. Ever since the Merge, more and more ETH is getting locked up in staking. Meanwhile, EIP-1559 keeps burning supply during periods of high activity. Less liquid ETH floating around means fewer coins to dump when the market freaks out — a built-in shock absorber, basically.
Bitcoin didn’t have that cushion. Liquidation data shows a massive spike on November 21 — almost $2 billion in blown-out positions in a single day — as BTC briefly nosedived toward $81,000. A fast bounce followed, dragging it back above $84,000 and then into the upper-$80Ks over the weekend.
Right now, BTC sits near $86,000… still down 10% on the week, ~19% over two weeks, ~23% over the month. ETH, though? Trading around $2,800 — also hurting, sure — but down 12%, 22%, and 29% over those same windows. Painful, but not the catastrophic ETH losses we’ve seen in past cycles.
Interestingly, Bitcoin’s MVRV ratio — one of the better mid-cycle valuation tools — dropped from 2.5 earlier this year to around 1.5 during the selloff, a zone that historically marks a mid-cycle reset rather than a euphoric blow-off top.
ETH’s Supply Looks Strong… But Leverage Looks Like a Time Bomb
Even with ETH holding its ground better than usual, some analysts are urging caution. CryptoOnchain flagged something that should make leveraged traders wince: Ethereum’s estimated leverage ratio on Binance hit an all-time high of 0.562 — while price dumped from $4,200 to $2,800.
So, what does that imply? Basically, people kept aping into leveraged longs as the chart was trending down. Classic “this can’t go lower” behavior. It leaves the market extremely vulnerable to another liquidation cascade if ETH slips again. One wrong move and the dominoes fall fast.
Others are calling the current environment a straight-up “Zebra Market.” It’s a term from XWIN Research — sharp black-and-white swings, clean wipes, short bursts of euphoria, followed by immediate fear. Not a clean bull. Not a real bear. Just razor-sharp volatility slicing both sides of the book.
In conditions like that, on-chain signals matter more than loud narratives… and right now those signals clearly say this was a Bitcoin-led flush. A messy, mid-cycle reset — not an Ethereum breakdown brewing underneath.