- HBAR is testing a major support level that has sparked strong reversals in the past, making this zone critical for its next move.
- Analysts highlight bullish divergence and a key demand zone, but indicators like RSI, MACD, and MA Ribbon still point toward bearish pressure.
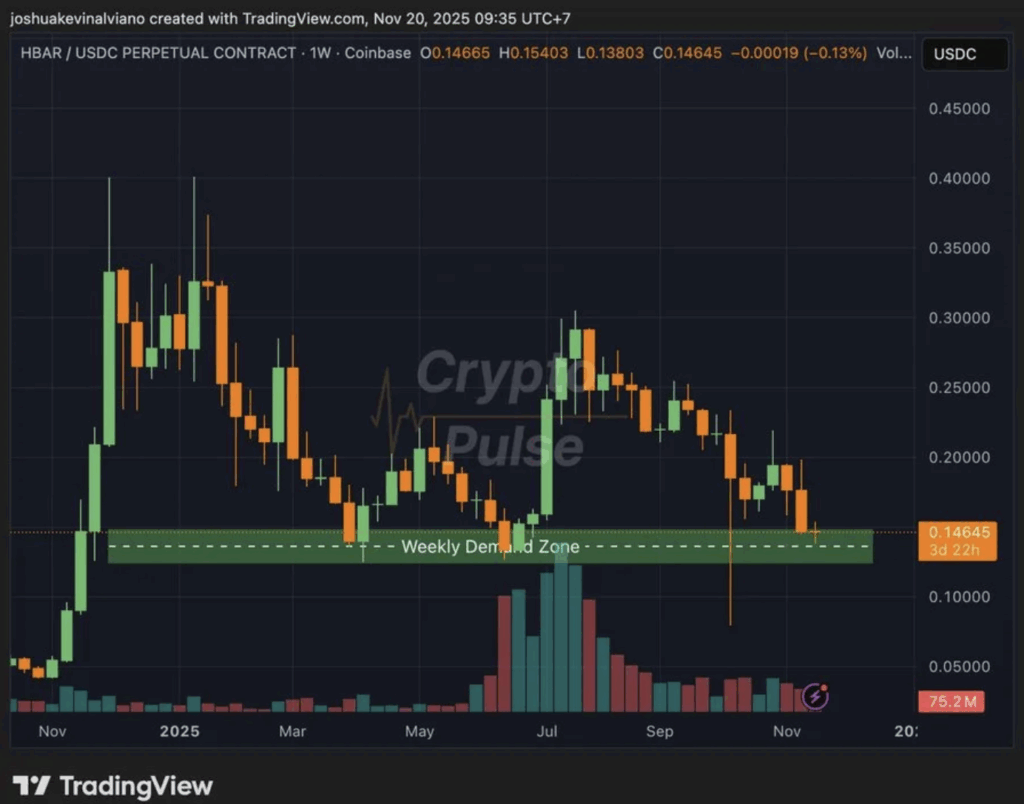
- A rebound toward $0.17–$0.19 is possible if support holds, while a breach below $0.12 could trigger deeper downside.
Hedera Hashgraph (HBAR) is hovering in one of those tense spots where the chart seems to be whispering that a rebound could be coming… but only if buyers hold the line a little longer. The token recently tapped a major support level, a zone that has sparked recoveries before, and many traders are quietly watching to see whether it holds or cracks. If this level stays intact, HBAR may drift upward again; if it breaks, well, the market may shove the token deeper into a downtrend. Right now, HBAR trades around $0.1464, with a 24-hour volume near $359.66M and a market cap of roughly $6.22B. The slight 1.01% dip in the last day reflects mild pressure, nothing dramatic, but enough to keep investors on edge about its next move.
Analysts eye demand zone as a possible springboard
CryptoPulse, a well-followed market analyst, highlighted that HBAR is resting right on its weekly demand zone—basically a spot where buyers have historically stepped in with some force. This area has acted as a launchpad for multiple reversals in the past, making it a key zone to defend. Unless HBAR slips beneath this base, the analyst believes the token could head back toward the $0.17 to $0.19 range. But a weekly close under $0.12 would flip that entire structure bearish, potentially opening the door for deeper declines that could unravel the momentum Hedera built earlier this year. It’s one of those moments where small price moves matter more than usual.
Bullish divergence hints at a possible bounce
Adding a small spark to the otherwise cautious sentiment, analyst Chad pointed out a bullish divergence forming between HBAR’s price and the Relative Strength Index on the 4-hour timeframe. When price drops while the RSI rises—or at least falls more slowly—it sometimes signals the selling pressure is cooling off. These divergences aren’t a guarantee of a reversal, but they can act like subtle clues that a bounce might be brewing. So far, the chart shows sellers slowing down, though not totally stepping aside just yet. This makes the current support zone even more important, since the divergence only matters if bulls start showing up with actual buy volume.
Momentum weakens as indicators lean bearish
Despite the early hints of strength, short-term indicators are still painting a pretty heavy picture. The RSI is sitting around 38.89, showing weak momentum and leaning closer to oversold territory. The MA Ribbon is spreading apart, with the 20-SMA at 0.15121 and the 50-SMA way up at 0.21421—classic signs of bear pressure building. Price action remains below the ribbon as well, which pretty much confirms buyers aren’t commanding anything at the moment. The MACD adds another layer of caution, sitting at -0.00994 while the signal line sits at -0.00106. The histogram shows steady red bars, signaling that bearish momentum hasn’t softened enough to mark a convergence or potential crossover yet. For now, the trend leans downward, and HBAR’s best hope lies in defending that support area before sellers gain too much control.