- The first U.S. spot XRP ETF launched with over $243M in inflows, but XRP price still dropped nearly 9% as market sentiment weakened.
- Institutional momentum is rising with Evernorth’s $1B XRP treasury filing and 149M XRP moving off exchanges into self-custody.
- XRP now trades in a tight range between $2.06–$2.26, with recovery hinging on a breakout above the $2.33–$2.47resistance zone.
Ripple’s XRP opened the new week with this strange mix of hype and hesitation, almost like the market couldn’t quite decide how to feel about one of its biggest catalysts finally going live. The very first U.S. spot XRP ETF — the Canary XRPC fund — hit Nasdaq and somehow pulled in more than $243 million in net inflows in just two trading days. On paper, that should’ve been massive.
But the XRP price didn’t behave the way most traders expected. Instead of pumping, the token slipped almost 9%, drifting down toward the $2.21 area while the broader market mood kinda soured around the same time.
Meanwhile, the institutional side of things is heating up. Evernorth Holdings filed to go public with a gigantic $1 billion XRP treasury, angling to launch regulated yield products and more tokenized-finance infrastructure around XRP. And on-chain data? Yeah—roughly 149 million XRP (around $335 million) has been moved off exchanges and into self-custody wallets. Normally that screams “accumulation,” but short-term momentum still feels a little shaky, honestly.
What the XRP Chart Is Whispering Right Now
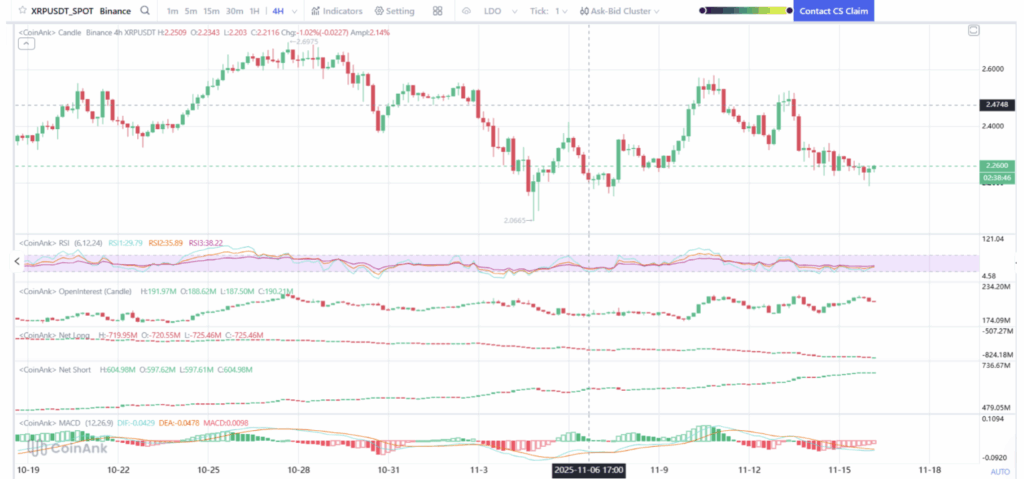
The 4-hour chart basically looks like a market trying to get its footing after a sharp knockdown. XRP bounced cleanly off the $2.06 level, but every attempt to reclaim the $2.47 region has been slapped down so far. That zone is now acting like the big ceiling everybody keeps staring at.
Price is kinda squeezing between $2.06 and $2.26, almost like it’s stuck in a tightening hallway. This kind of sideways drift usually shows up after major events — in this case, the ETF launch — when traders take a breath and wait for the next wave of momentum to choose a direction.
If XRP can break back into the $2.33–$2.47 zone with real volume behind it, there’s room for a proper recovery push. But if buyers keep getting rejected there, a revisit to $2.06 is still very much on the table.
Market Indicators: Still Nervous, Not Hopeless
Momentum indicators are basically echoing that same “meh, but maybe soon” vibe. The RSI is hanging around 35–40 on the 4H, which means buying strength is weak, yeah, but also leaves tons of room for an upside surprise if momentum suddenly flips.
Open interest is around $190 million but slowly trending downward. That’s the classic post-event cooldown where traders scale back after a “big news moment” didn’t spark the rally everyone hoped for.
The MACD is still sitting below the signal line, though the histogram is flattening out. Sometimes that’s the earliest hint of a shift — the calm right before momentum starts leaning the other way — but for now, sellers still hold the wheel.
Overall, the market feels undecided. Not bearish enough to collapse, not bullish enough to call a comeback. Just stuck somewhere in the middle, waiting.
XRP Price Outlook for This Week
The level to watch like a hawk is $2.20. If XRP can hold above that and carve out a base, the next steps higher are $2.33 and then that annoying wall at $2.47. A clean breakout above $2.47 would finally signal that the market is responding properly to the ETF momentum.
But if XRP slips back toward $2.06, the mood flips bearish again. Losing that level would open the door to $2.00, maybe even $1.90 if things get sloppy.
Right now, everything feels split down the middle. Fundamentals are clearly improving — first ETF, rising institutional interest, heavy outflows into self-custody — but the chart just hasn’t caught up yet.
This week probably hinges on one question:
Can XRP flip the $2.33–$2.47 zone into support and finally build a real post-ETF recovery?