
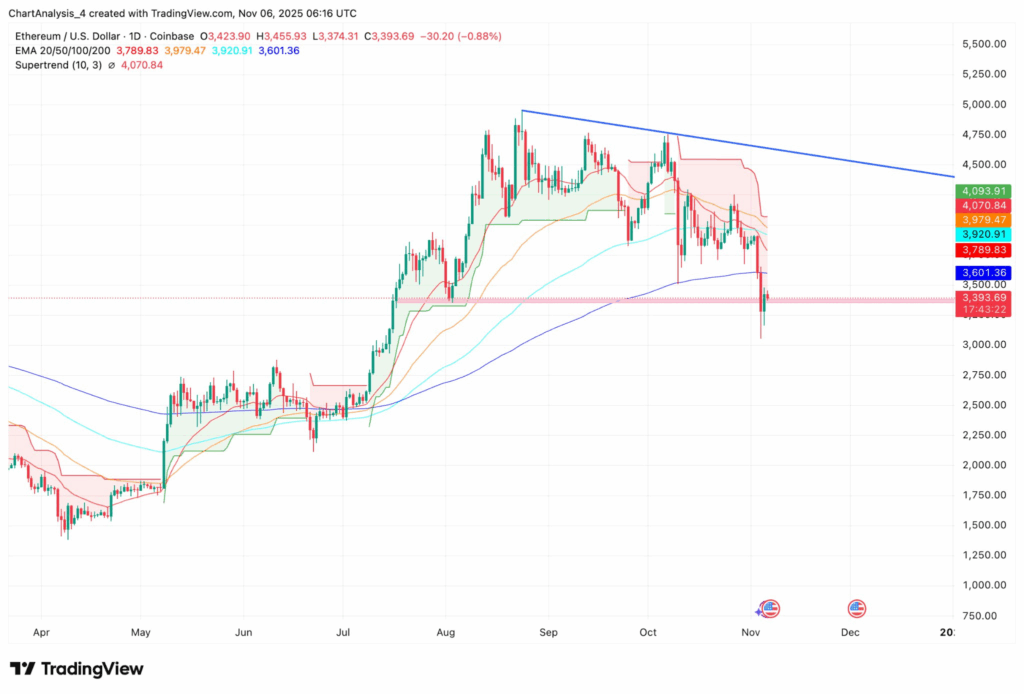
- Ethereum broke below $3,500, confirming a bearish trend and flipping EMAs into resistance.
- On-chain data shows active distribution, rising short exposure, and long liquidations.
- Key downside targets lie near $3,150 and $2,900 unless bulls reclaim the $3,500 zone.
Ethereum (ETH) extended its decline this week, slipping to around $3,390 after breaking below the critical $3,500 support, which has now flipped into firm resistance. The move confirms a bearish shift in market structure, with ETH trading beneath all major exponential moving averages (EMAs) — each now acting as overhead resistance.

Technical Breakdown Confirms Bearish Momentum
Ethereum’s drop below the 200-day EMA near $3,600 signaled that sellers had fully regained control. Since then, every rebound attempt has been met with lower highs, while the supertrend indicator has turned bearish for the first time in months.
On the daily chart, ETH trades beneath a descending trendline drawn from the April highs, and rallies into that zone have consistently triggered fresh selling. The current battle lies between $3,350–$3,500, a fading demand zone that could soon give way to deeper liquidity levels near $3,150 and $2,900 — the latter marking a strong accumulation area seen in July.
Unless bulls reclaim $3,500 with strong buying volume, price action will likely remain corrective rather than structural, keeping the broader trend tilted lower.
On-Chain and Derivatives Data Reinforce Bearish Tone
Exchange flow data from Coinglass shows consistent spot outflows of –$74.22 million on November 6, signaling active distribution as tokens move onto exchanges. Such sustained outflows typically precede extended selloffs rather than accumulation phases.
Meanwhile, open interest climbed 2.19% to $39.59 billion, even as prices fell — suggesting that short positions are entering the market. Options volume, however, plunged more than 50%, showing traders shifting away from hedging to more aggressive directional short exposure.
Liquidation data also confirms more longs being wiped out than shorts, a classic sign of forced selling pressure. Notably, top-trader ratios remain net long, indicating some large holders have yet to unwind positions — a potential setup for a final capitulation flush toward $3,150 or even $2,900.
Outlook and Key Price Zones
For Ethereum bulls, the roadmap is clear: reclaim $3,500 and break above the clustered EMAs to shift sentiment back toward neutral. Doing so could reopen targets around $3,920 and $4,100, both aligning with the descending trendline resistance.
Until that happens, ETH remains in a liquidity-seeking phase, where leverage and sentiment dominate over fundamentals. Rising short exposure and heavy exchange flows suggest further downside risk before a meaningful base forms.