
- BNB drops 12% after reaching an all-time high of $1,370.
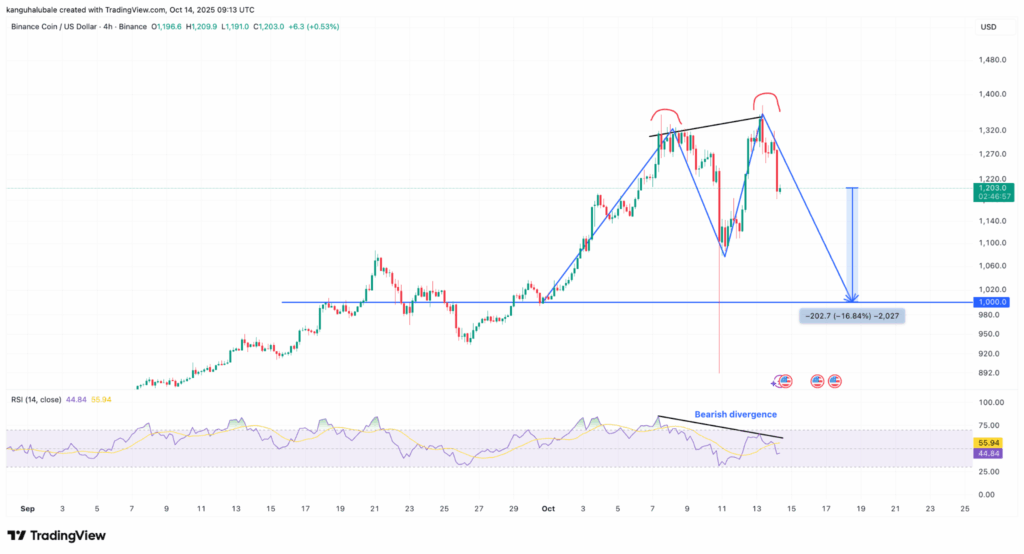
- Analysts expect support around $1,000, with upside targets near $2,000.
- Bull flag pattern and on-chain strength suggest long-term momentum remains bullish.
BNB has slipped roughly 12% from its all-time high of $1,370, cooling off after a blistering rally that made it the third-largest cryptocurrency by market cap. The dip comes amid a broader risk-off shift in the crypto market, with traders taking profits following last week’s massive volatility.
Short-Term Pullback or End of the Rally?
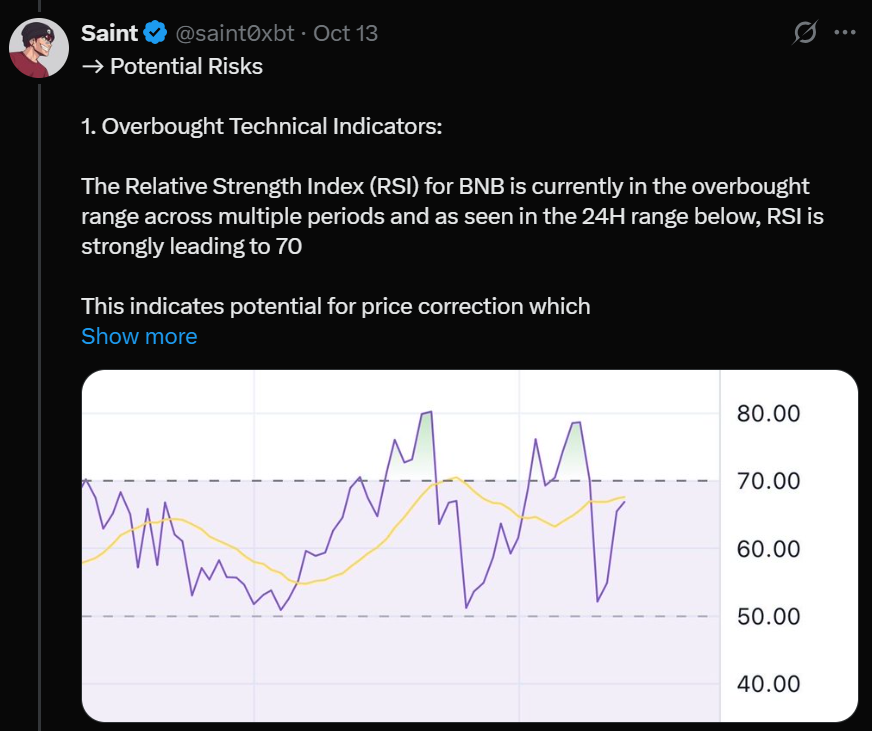
On the daily chart, BNB’s RSI remains in the overbought zone, dropping from 81 to 71 — a signal often followed by brief corrections. Analysts warn that a move toward the $1,000 psychological level looks likely as the market resets from overheated conditions. Historically, similar setups in 2021 and 2024 led to 40–70% retracements before the next leg higher.
The four-hour chart also paints a cautious picture, showing a double-top pattern that projects a possible retest of $1,000 as support. If selling continues, deeper retracements toward the $860–$730 zone could follow, where key moving averages currently sit.
Why Analysts Still See $2,000 in Play
Despite the correction, the broader trend still looks bullish. On higher timeframes, BNB continues to respect a multi-month bull flag pattern dating back to late 2023 — one that suggests the next major target could be around $2,100, or roughly 73% higher from current prices.
Market observers also point to strong fundamentals: high BNB Chain activity, ongoing fee burns, and Binance’s recent $283 million user compensation campaign, all of which help reinforce investor confidence. Some traders even speculate BNB could “flip ETH” in market cap if the current pace continues.
The Bottom Line
BNB’s recent pullback looks more like a healthy cooldown than a full reversal. With the broader market stabilizing and strong ecosystem demand, analysts believe the bull run isn’t over — just catching its breath before the next leg up.